Fig. 2.
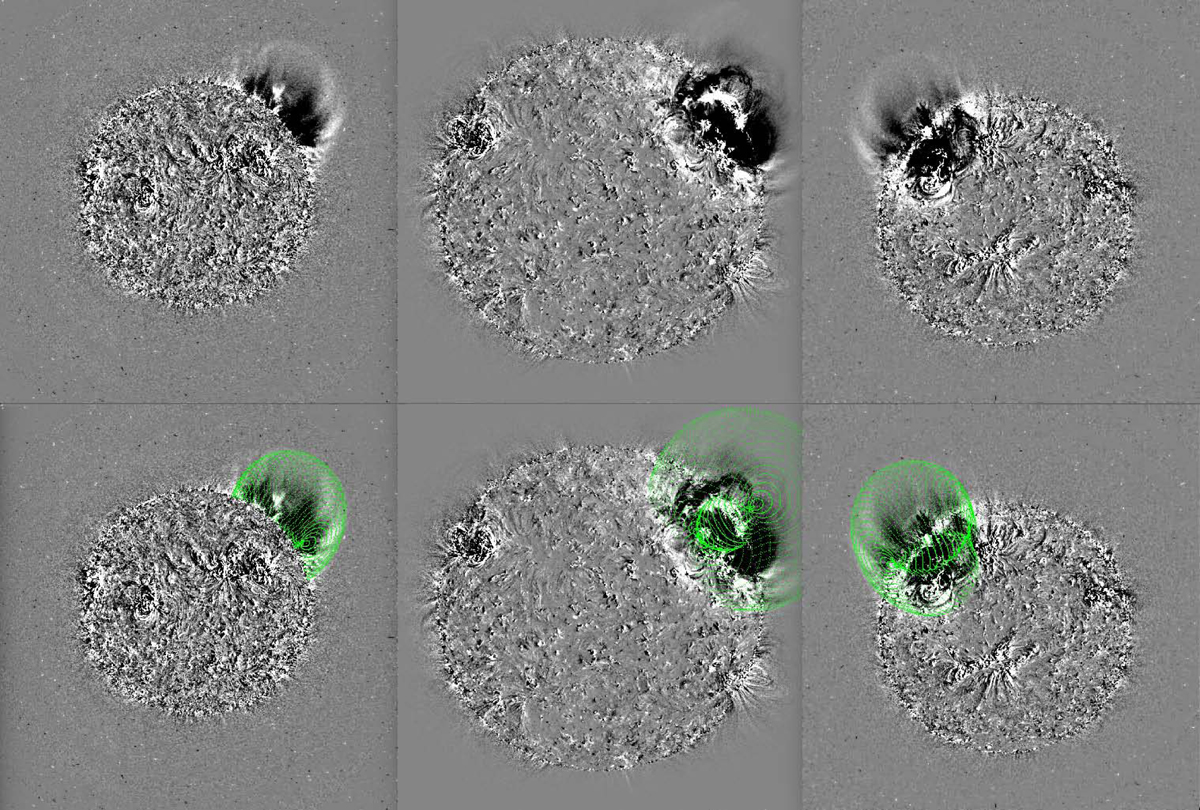
Incipient CME on 14 December 2010 at 15:20 as seen in the low corona from STEREO EUVI-B 195 Å (left), SDO AIA 193 Å (center), and STEREO EUVI-A 195 Å (right). A previous image has been subtracted in all cases to enhance visibility of the event. The bottom row adds the GCS model fit superimposed as a green mesh, as described in Sect. 2.2.
Current usage metrics show cumulative count of Article Views (full-text article views including HTML views, PDF and ePub downloads, according to the available data) and Abstracts Views on Vision4Press platform.
Data correspond to usage on the plateform after 2015. The current usage metrics is available 48-96 hours after online publication and is updated daily on week days.
Initial download of the metrics may take a while.