Fig. 8
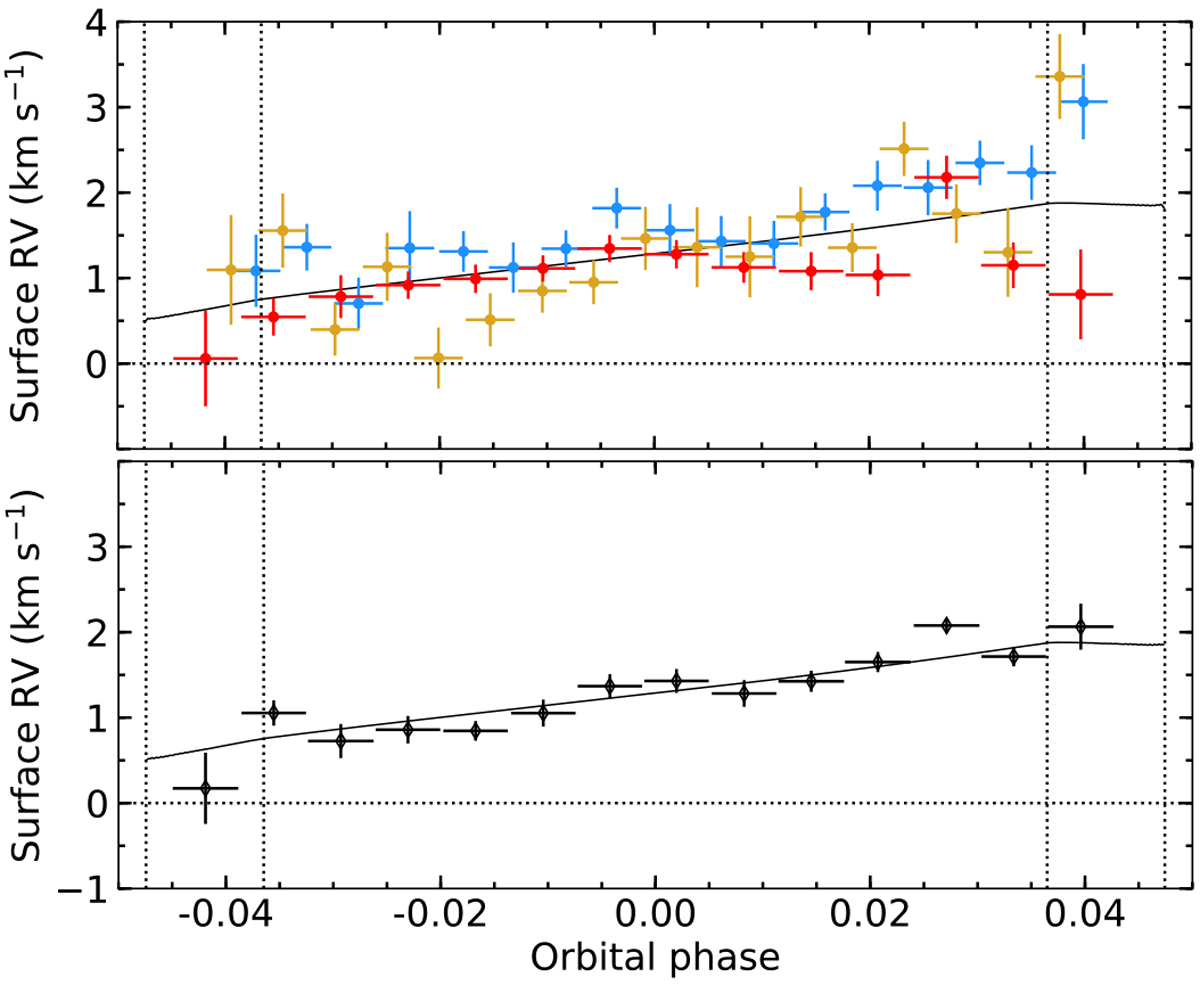
Radial velocities of the stellar surface regions occulted by WASP-121b as a function of orbital phase. Horizontal bars show the exposure durations. The black curve is the best-fit reloaded RM model (indistinguishable between the low- and high- i* solutions) to the three visits. Dashed vertical lines are the transit contacts. The horizontal dashed line highlights the stellar rest velocity, which is found along the projected stellar spin axis. Upper panel: local RVs in individual Visits 1 (red), 2 (gold), and 3 (blue). Bottom panel: local RVs derived from the CCFloc binned over the three visits, shown separately for the sake of clarity.
Current usage metrics show cumulative count of Article Views (full-text article views including HTML views, PDF and ePub downloads, according to the available data) and Abstracts Views on Vision4Press platform.
Data correspond to usage on the plateform after 2015. The current usage metrics is available 48-96 hours after online publication and is updated daily on week days.
Initial download of the metrics may take a while.