Fig. 7
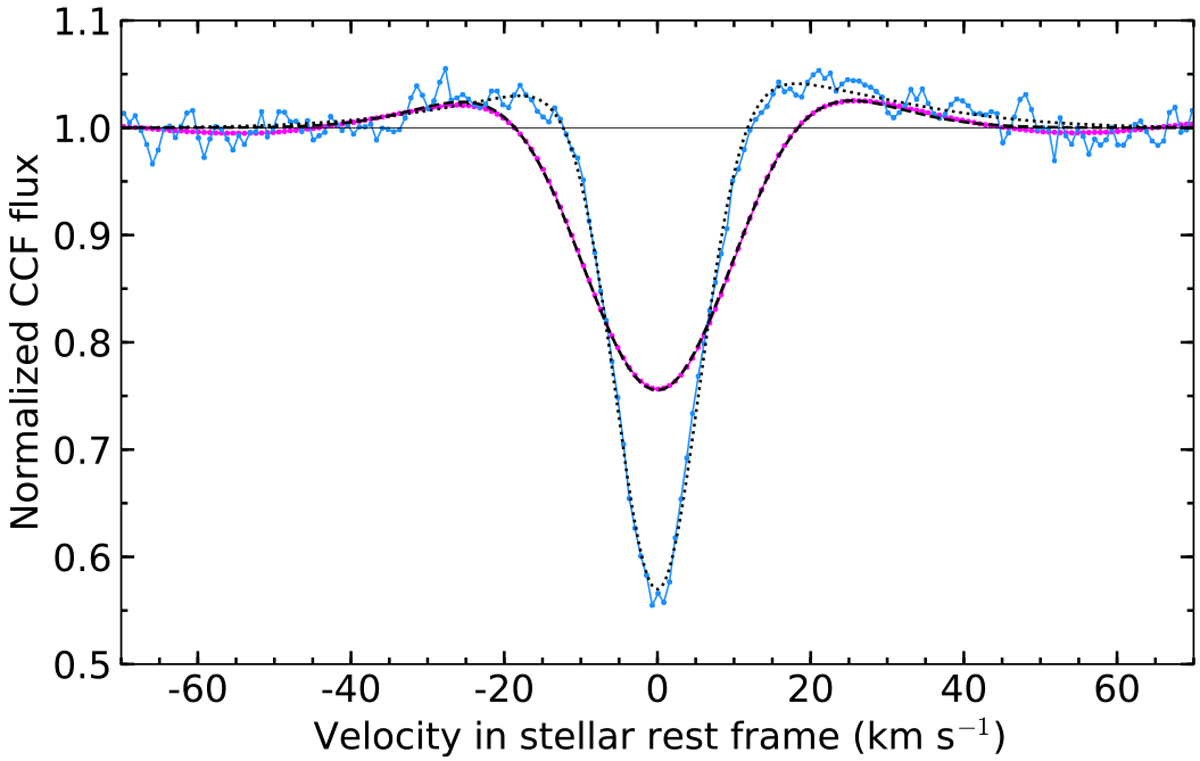
Master-out CCFDI (magenta) and master local CCFloc (blue), binned over the three visits and normalized to the same continuum. The dashed and dotted black profiles show the best-fit models to the master-out and master-local, respectively. They are based on the same double-Gaussian model, but with different correlations between the properties of the lobe and core Gaussian components.
Current usage metrics show cumulative count of Article Views (full-text article views including HTML views, PDF and ePub downloads, according to the available data) and Abstracts Views on Vision4Press platform.
Data correspond to usage on the plateform after 2015. The current usage metrics is available 48-96 hours after online publication and is updated daily on week days.
Initial download of the metrics may take a while.