Fig. 6
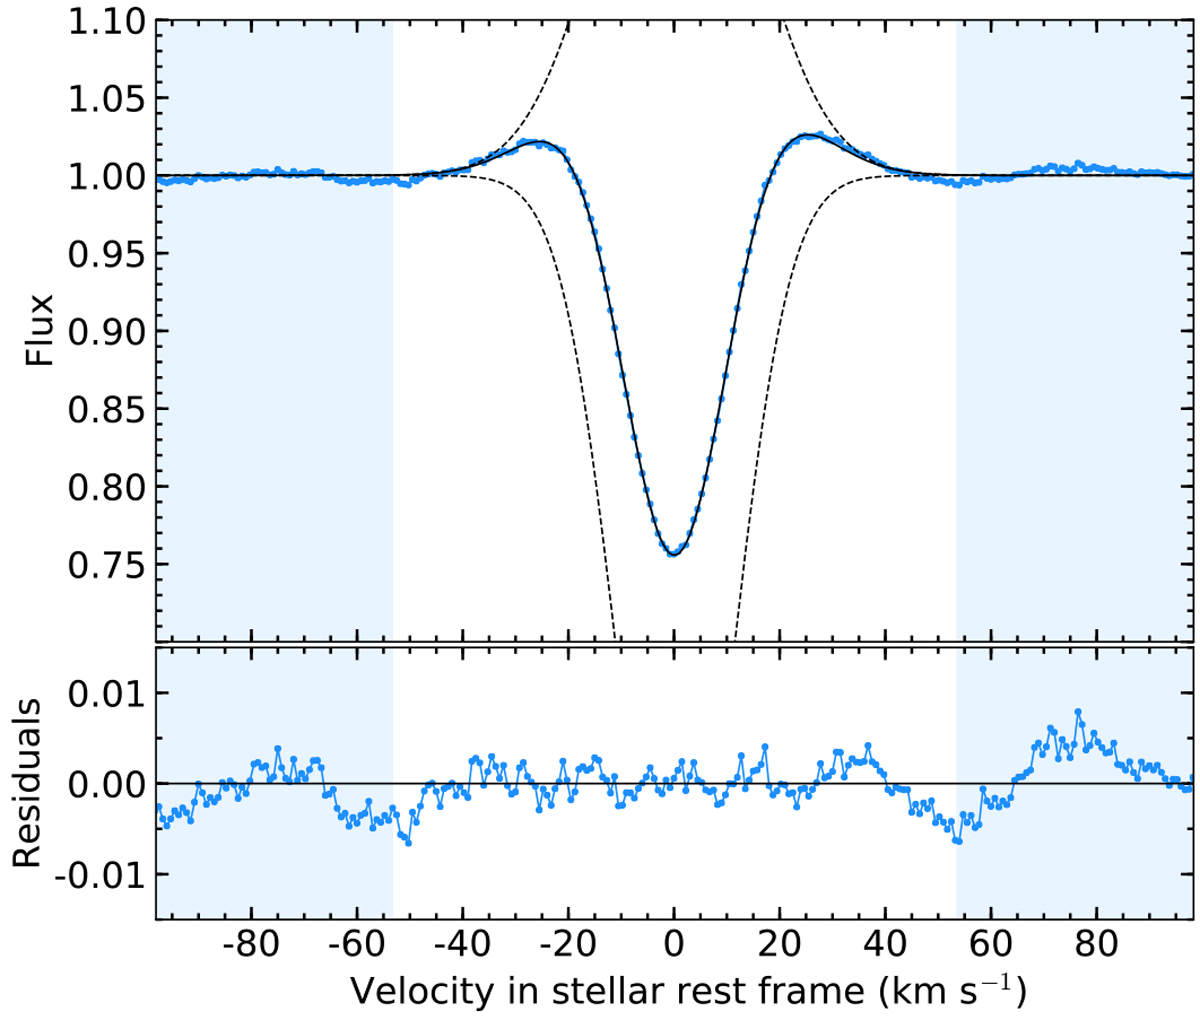
Typical CCFDI integrated over the disk of WASP-121 (blue points, obtained during one of the out-of-transit exposures in Visit 2). The solid black profile is the best-fit double-Gaussian model to the measured CCF. The dashed black profiles show the individual Gaussian components to this model, which yields a low dispersion on the fit residual (bottom panel). The blue shaded regions indicate the velocity ranges used to define the CCF continuum.
Current usage metrics show cumulative count of Article Views (full-text article views including HTML views, PDF and ePub downloads, according to the available data) and Abstracts Views on Vision4Press platform.
Data correspond to usage on the plateform after 2015. The current usage metrics is available 48-96 hours after online publication and is updated daily on week days.
Initial download of the metrics may take a while.