Fig. 5
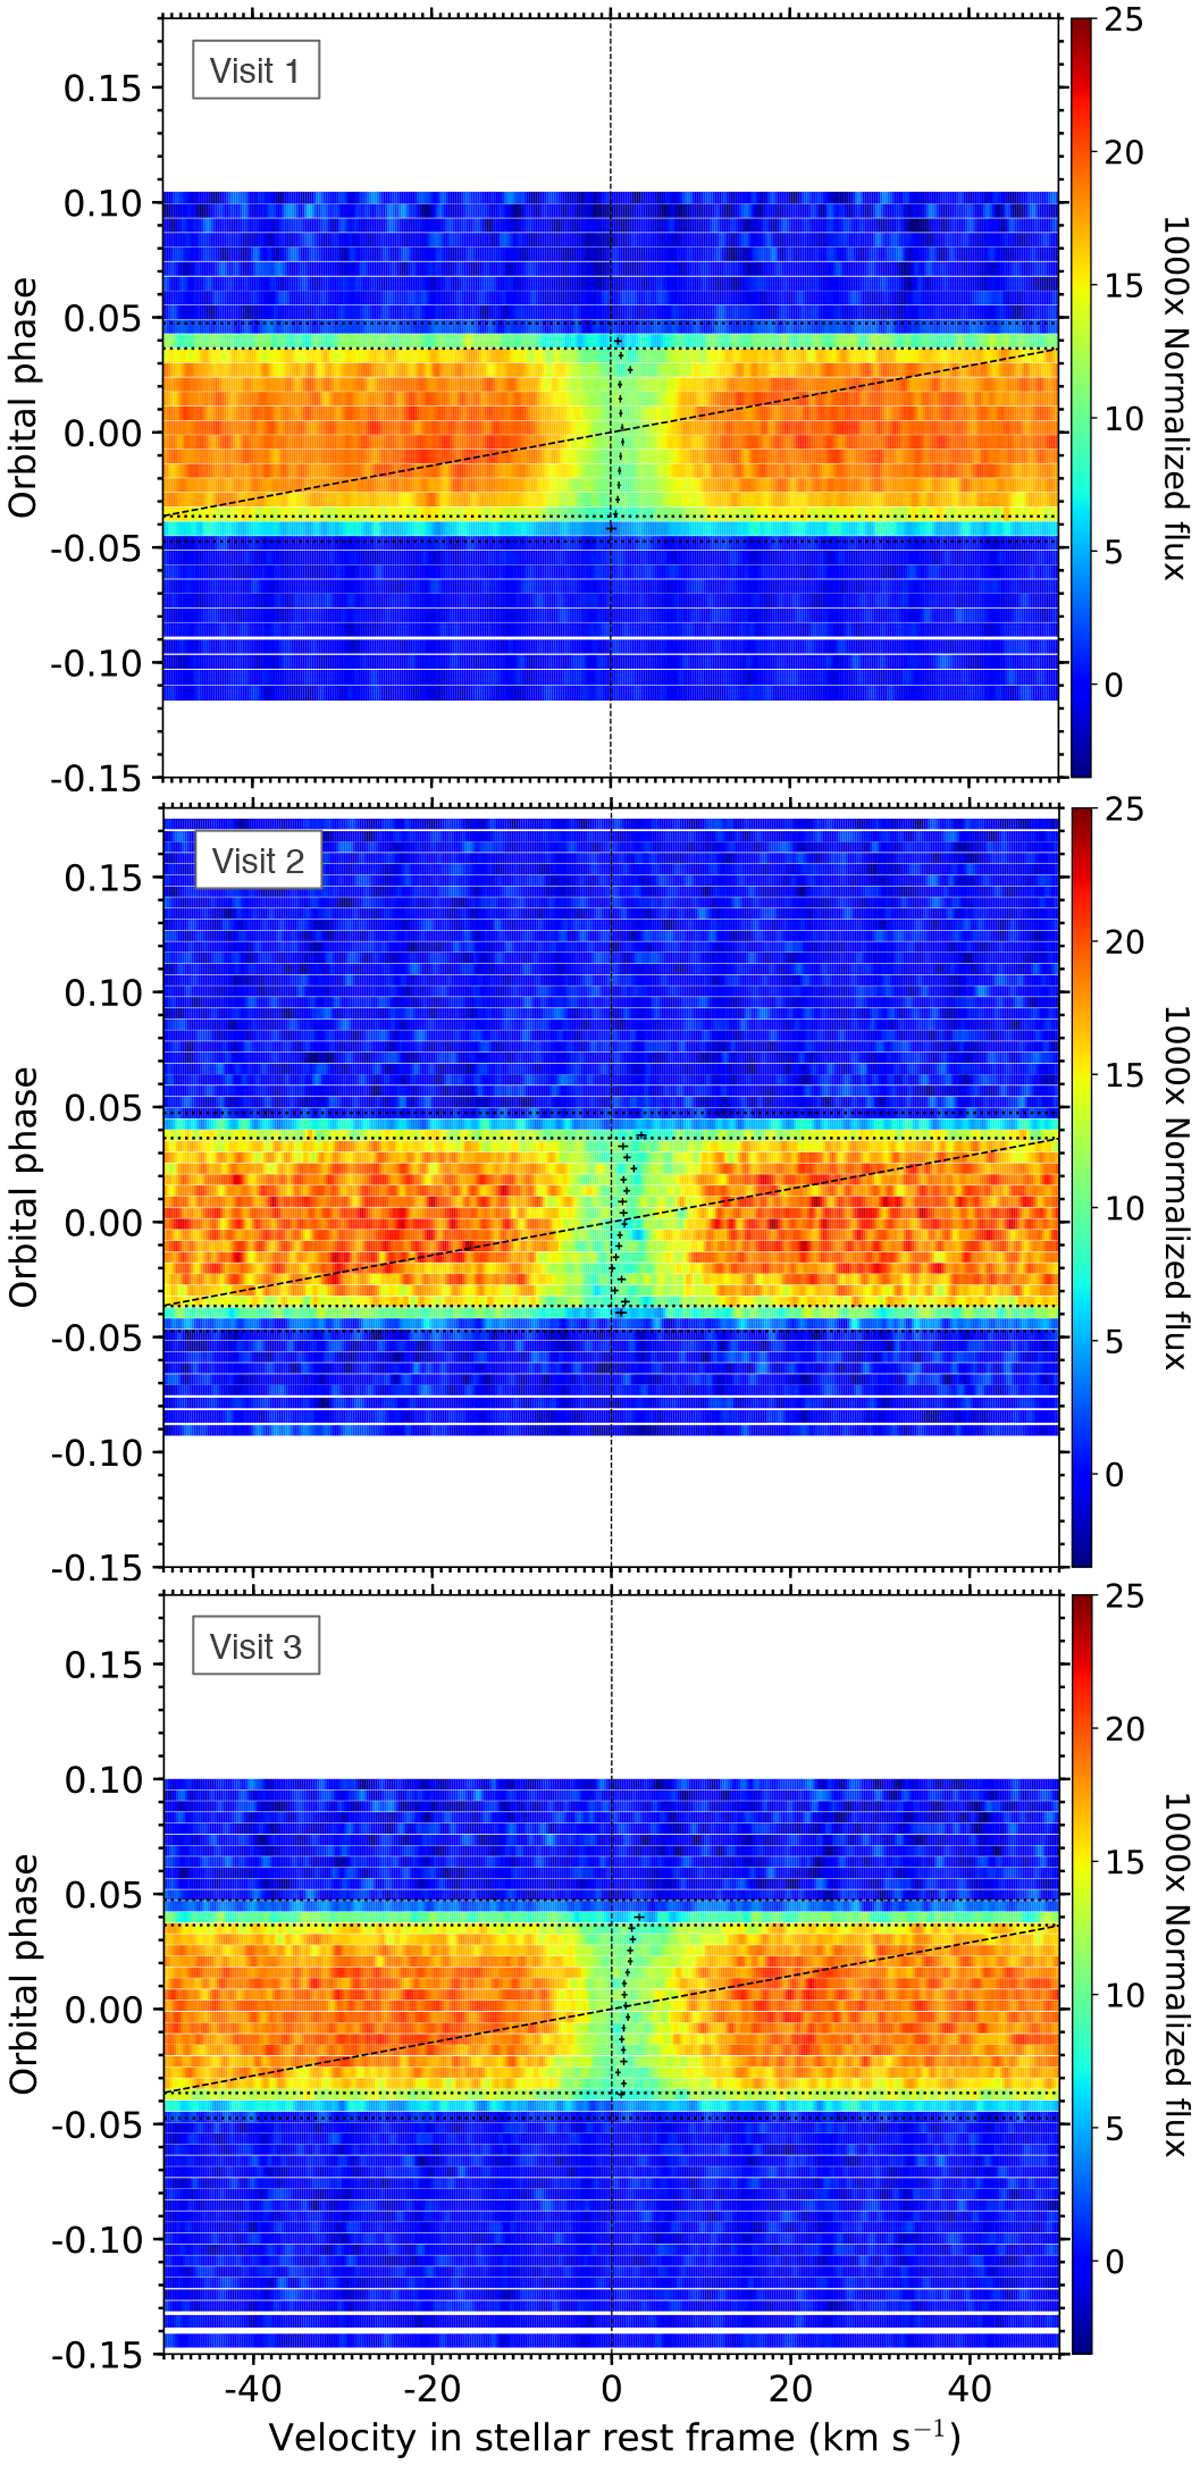
Maps of the residuals between the scaled CCFDI and their master-out in each visit. Residuals are colored as a function of their flux, and plotted as a function of RV in the stellar rest frame (in abscissa) and orbital phase (in ordinate). The vertical dashed black line indicates the stellar rest velocity. Horizontal dotted lines are the transit contacts. In-transit residuals correspond to the CCFloc, and show the average local stellar line profile (recognizable by a lower flux in the CCFloc cores) from the planet-occulted regions of the stellar disk. For comparison, the spectroscopic width of the disk-integrated stellar lines is about 14 km s−1. Black crosses with error bars indicate the centroids of the detected stellar line profile. The slanted dashed black line tracks the orbital trajectory of the planet.
Current usage metrics show cumulative count of Article Views (full-text article views including HTML views, PDF and ePub downloads, according to the available data) and Abstracts Views on Vision4Press platform.
Data correspond to usage on the plateform after 2015. The current usage metrics is available 48-96 hours after online publication and is updated daily on week days.
Initial download of the metrics may take a while.