Fig. 2
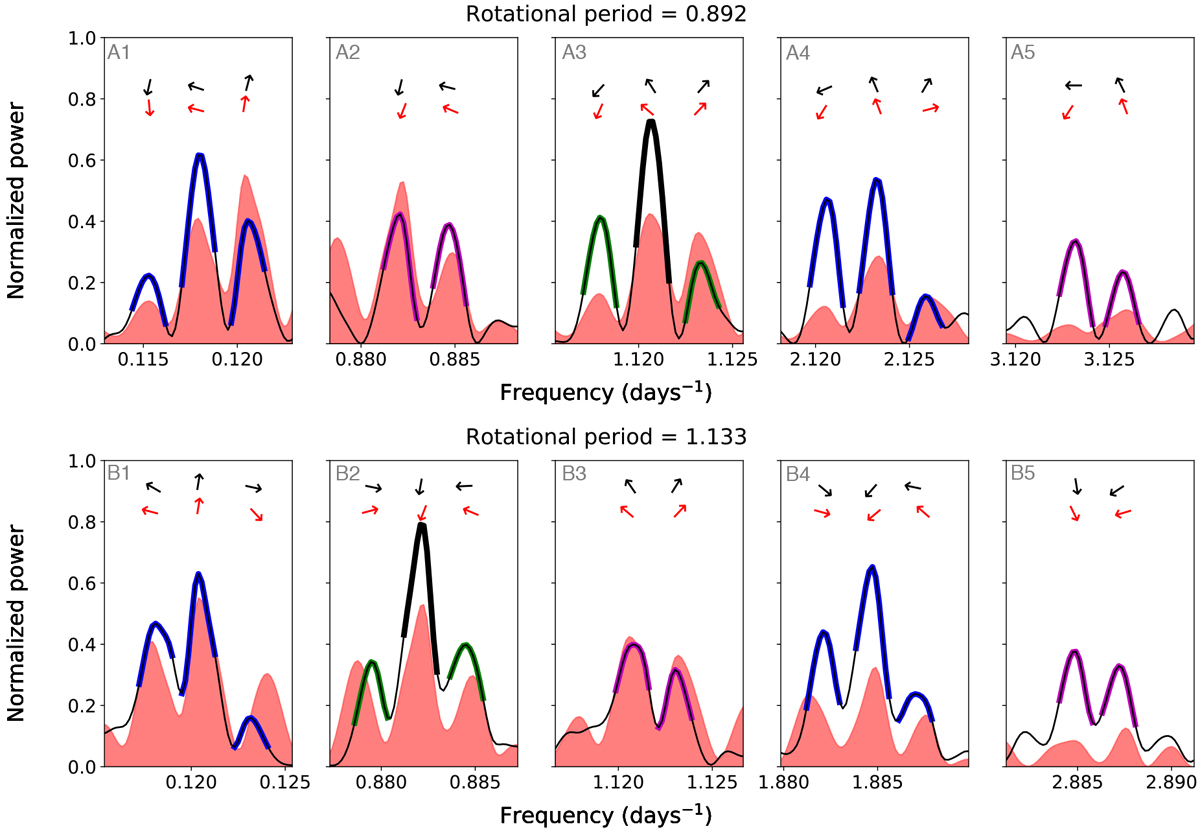
Comparison between the real and alias signals in the RV data of WASP-121 corrected for the planet signal (red shadow) and in the simulated data (black). Top panels: 0.89-day signal, bottom panels: 1.13-day signal. These plots correspond to one realization of noise out of 100 different trials. Real signals are shown in black (panels A3 and B2), yearly aliases (± 0.0027 days−1) in green (panels A3 and B2), daily aliases (±1, ± 1.0027 and ± 1.0056 days−1) in blue (panels A1, A4, B1, and B4), and 2-day aliases (± 2.0027 and ± 2.0055 days−1) in purple (panels A2, A5, B3, and B5). Arrows at the top of each peak show the phase of each signal for the real (red) and the simulated data (black).
Current usage metrics show cumulative count of Article Views (full-text article views including HTML views, PDF and ePub downloads, according to the available data) and Abstracts Views on Vision4Press platform.
Data correspond to usage on the plateform after 2015. The current usage metrics is available 48-96 hours after online publication and is updated daily on week days.
Initial download of the metrics may take a while.