Fig. B.1
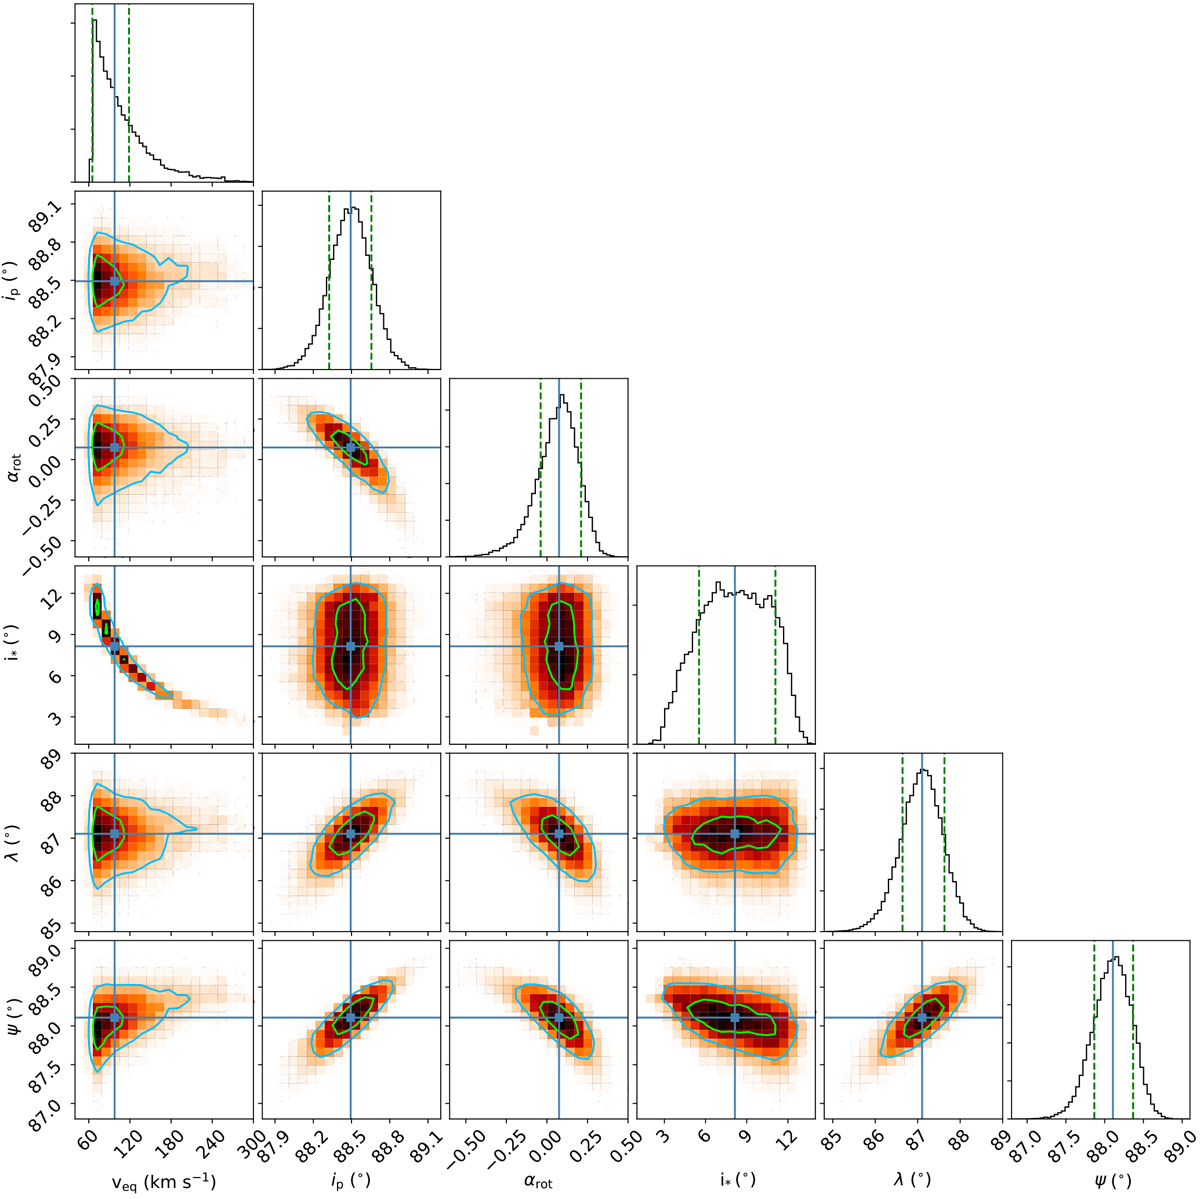
Correlation diagrams for the probability distributions of the updated reloaded RM model parameters. Samples have been limited to the region with low stellar inclination. The inner green and outer light blue contours show the 1 and 2σ simultaneous 2D confidence regions that contain 39.3 and 86.5% of the samples, respectively. 1D histograms correspond to the distributions projected on the space of each line parameter. The deep blue lines indicate their median values, with dashed green lines showing the 1σ highest density intervals. ψ is derived from other parameters and is not an MCMC jump parameter.
Current usage metrics show cumulative count of Article Views (full-text article views including HTML views, PDF and ePub downloads, according to the available data) and Abstracts Views on Vision4Press platform.
Data correspond to usage on the plateform after 2015. The current usage metrics is available 48-96 hours after online publication and is updated daily on week days.
Initial download of the metrics may take a while.