Fig. 11
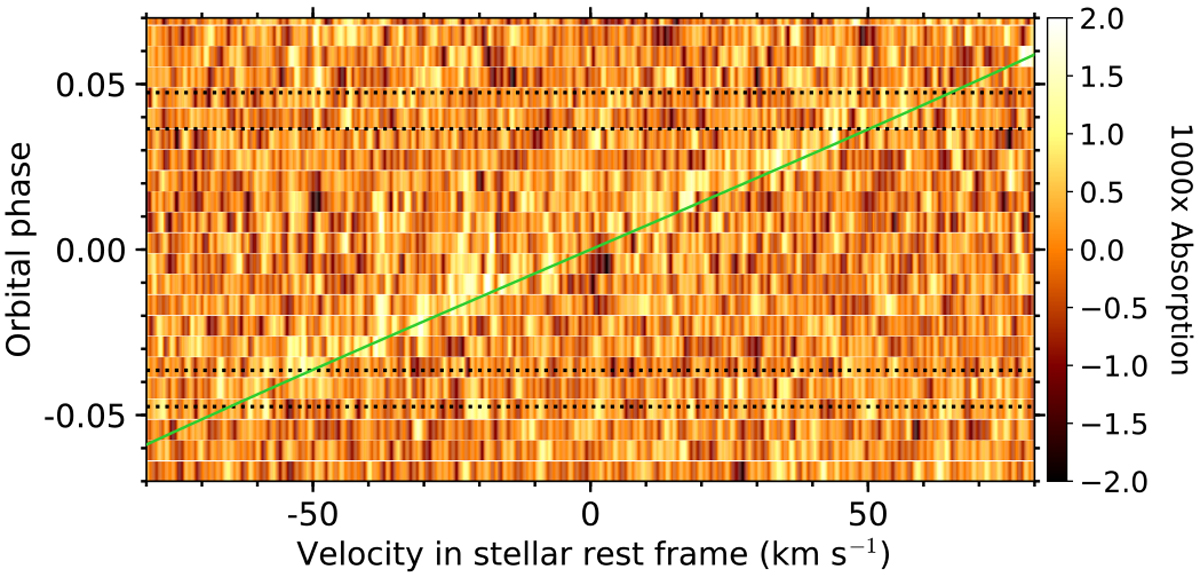
Map of the atmospheric CCFatm binned over the three visits, colored as a function of absorption, and plotted as a function of RV in the stellar rest frame (in abscissa) and orbital phase (in ordinate). Horizontal dotted lines are the transit contacts. The bright streak is the absorption signature from the planetary atmosphere. It follows the track of the planetary orbital motion (solid green curve), but with a slight blueshift.
Current usage metrics show cumulative count of Article Views (full-text article views including HTML views, PDF and ePub downloads, according to the available data) and Abstracts Views on Vision4Press platform.
Data correspond to usage on the plateform after 2015. The current usage metrics is available 48-96 hours after online publication and is updated daily on week days.
Initial download of the metrics may take a while.