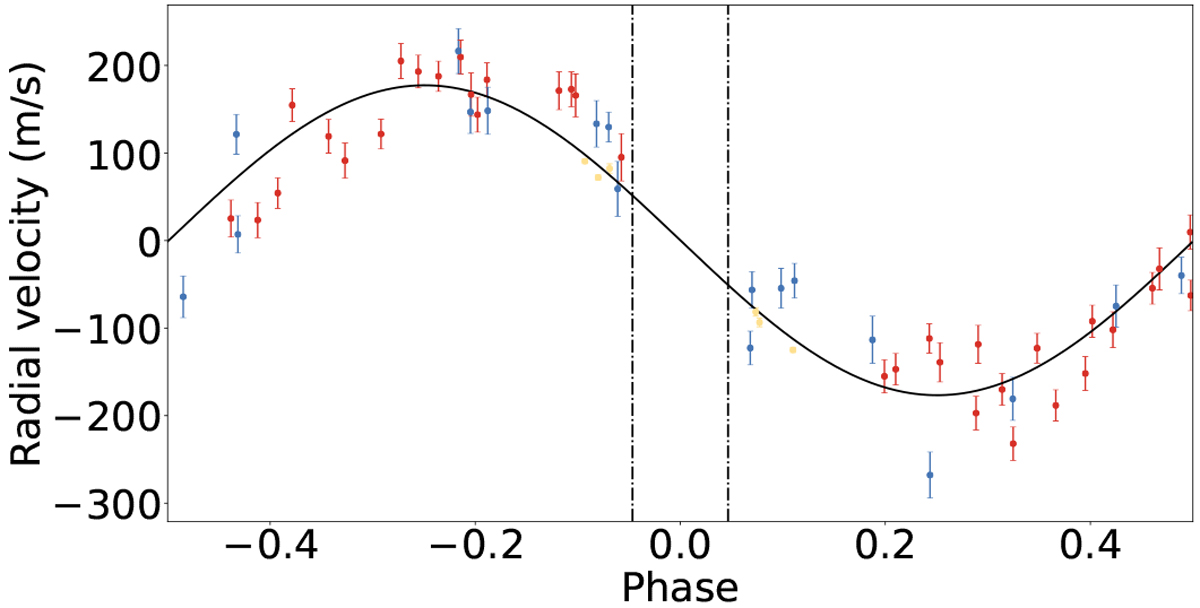
Fig. 1

Radial velocities of WASP-121b, phase-folded with the orbital period and detrended from stellar activity. Coralie data pointshave been obtained before (red) and after (blue) the fiber upgrade (Ségransan et al. 2010). HARPS datapoints are shown in gold. Our best-fit Keplerian model to the out-of-transit data is shown as a solid black line (datapoints obtained in the frame of transit observations were binned, see text). The first and fourth transit contacts are indicated bydash-dotted vertical black lines.
Current usage metrics show cumulative count of Article Views (full-text article views including HTML views, PDF and ePub downloads, according to the available data) and Abstracts Views on Vision4Press platform.
Data correspond to usage on the plateform after 2015. The current usage metrics is available 48-96 hours after online publication and is updated daily on week days.
Initial download of the metrics may take a while.


