Fig. 5.
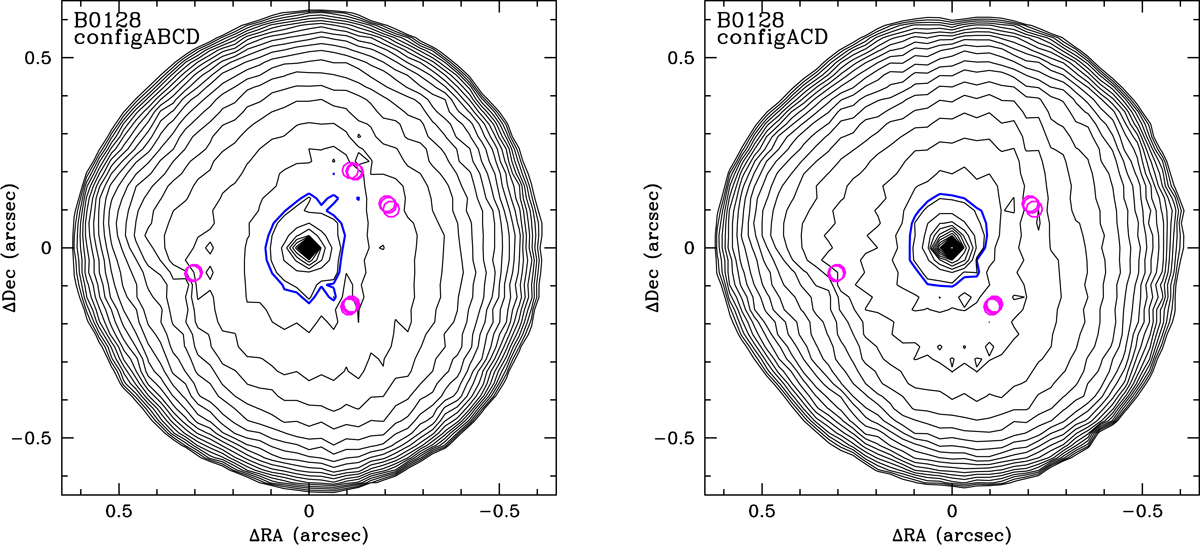
PixeLens reconstructed maps of lensing convergence. Left: using all twelve subcomponents of B0128. Right: using only the nine subcomponents of images A, C, and D. The subcomponents used as constraints in each case are indicated with magenta circles. The grey iso-convergence contours are spaced logarithmically. The blue contour is the iso-convergence contour at κ(x) = 1.
Current usage metrics show cumulative count of Article Views (full-text article views including HTML views, PDF and ePub downloads, according to the available data) and Abstracts Views on Vision4Press platform.
Data correspond to usage on the plateform after 2015. The current usage metrics is available 48-96 hours after online publication and is updated daily on week days.
Initial download of the metrics may take a while.