Fig. 4.
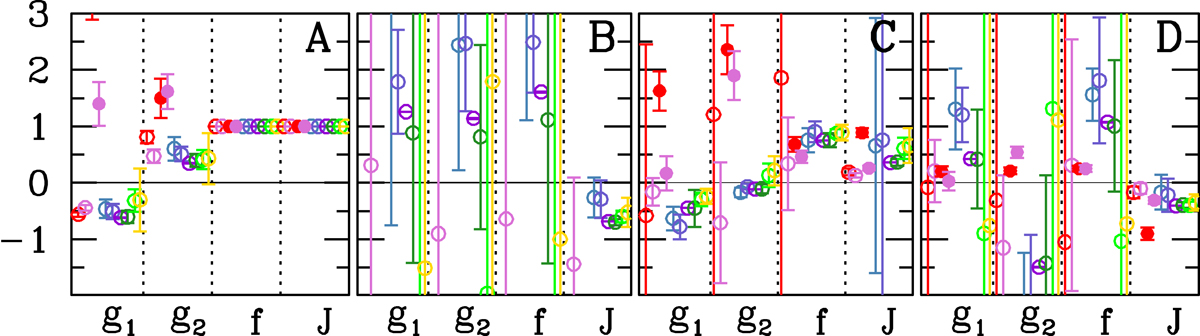
Graphical representation of the results presented in Tables 5 and 7. Each panel corresponds to one image of B0128, as labelled. Within each panel, we plot the values of g1, g2, f, and 𝒥 in 4 columns, separted by thin black vertical dotted lines. In each of these columns, there are 10 points, with confidence bounds, representing the four models from Table 5, and six models from Table 7 For image A, all values of f and 𝒥 are, by definition, 1.
Current usage metrics show cumulative count of Article Views (full-text article views including HTML views, PDF and ePub downloads, according to the available data) and Abstracts Views on Vision4Press platform.
Data correspond to usage on the plateform after 2015. The current usage metrics is available 48-96 hours after online publication and is updated daily on week days.
Initial download of the metrics may take a while.