Fig. 8
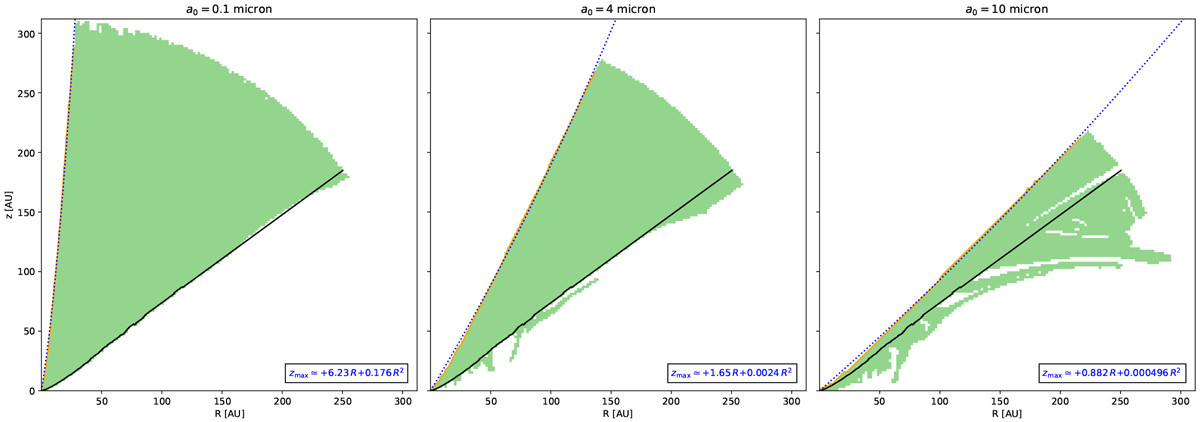
Areas populated by the dust grains (green); since we do not start from a realistic distribution along the base of the wind, we do not portray a density map. Smaller grains reach higher z at similar R. Wind base in black, numerical ![]() in orange, and corresponding fit in (dotted) blue; fits according to Eq. (1) annotated. (For all a0, see Fig. C.3.)
in orange, and corresponding fit in (dotted) blue; fits according to Eq. (1) annotated. (For all a0, see Fig. C.3.)
Current usage metrics show cumulative count of Article Views (full-text article views including HTML views, PDF and ePub downloads, according to the available data) and Abstracts Views on Vision4Press platform.
Data correspond to usage on the plateform after 2015. The current usage metrics is available 48-96 hours after online publication and is updated daily on week days.
Initial download of the metrics may take a while.