Fig. 6
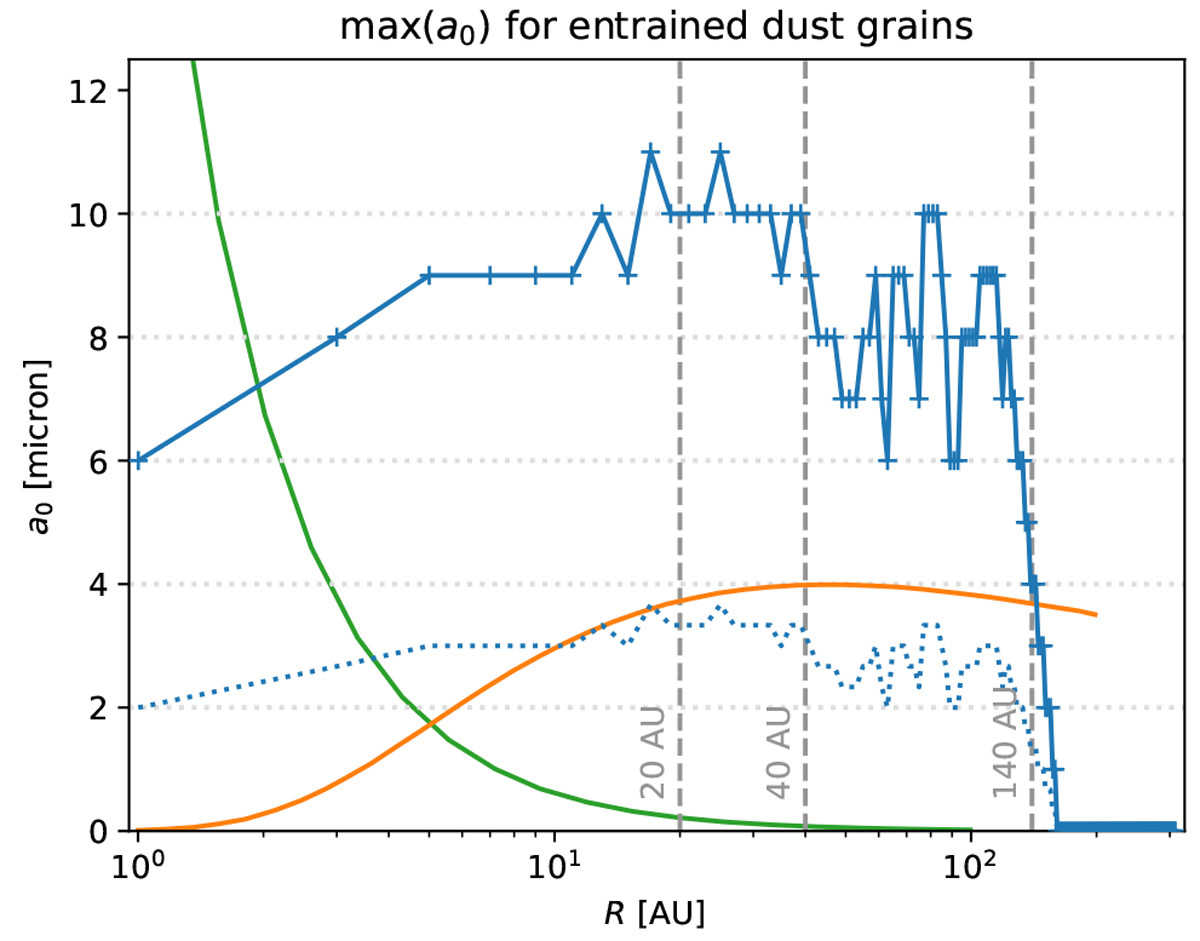
Size of the largest grains entrained from a point R along the base of the wind (blue, peak at about 20 AU); the saw-tooth appearance of the curve at larger R is caused by the finite resolution of the underlying gas grid. When comparing to Hutchison et al. (2016a, their Fig. 7 for M* = 0.75 M⊙) (orange, peak at around 40 AU), we can see the size enhancement – especially at smaller R – caused by the inclusion of X-rays in our photoevaporative wind model. The blue dashed line represents our results scaled down by a factor of 3, to compensate for the differing internal grain densities of Hutchison et al. (2016a) and this work; yet, Ṁw still differsbetween the models, making a direct comparison difficult. The MHD wind model investigated by Miyake et al. (2016, their Fig. 4) (green) shows a distinctly different entrainment curve, starting off at very high a0 in the jet region but dropping towards max (a0) = 0 very quickly.Around R ≃ 140 AU, our max (a0) plummets to 0.
Current usage metrics show cumulative count of Article Views (full-text article views including HTML views, PDF and ePub downloads, according to the available data) and Abstracts Views on Vision4Press platform.
Data correspond to usage on the plateform after 2015. The current usage metrics is available 48-96 hours after online publication and is updated daily on week days.
Initial download of the metrics may take a while.