Fig. 4
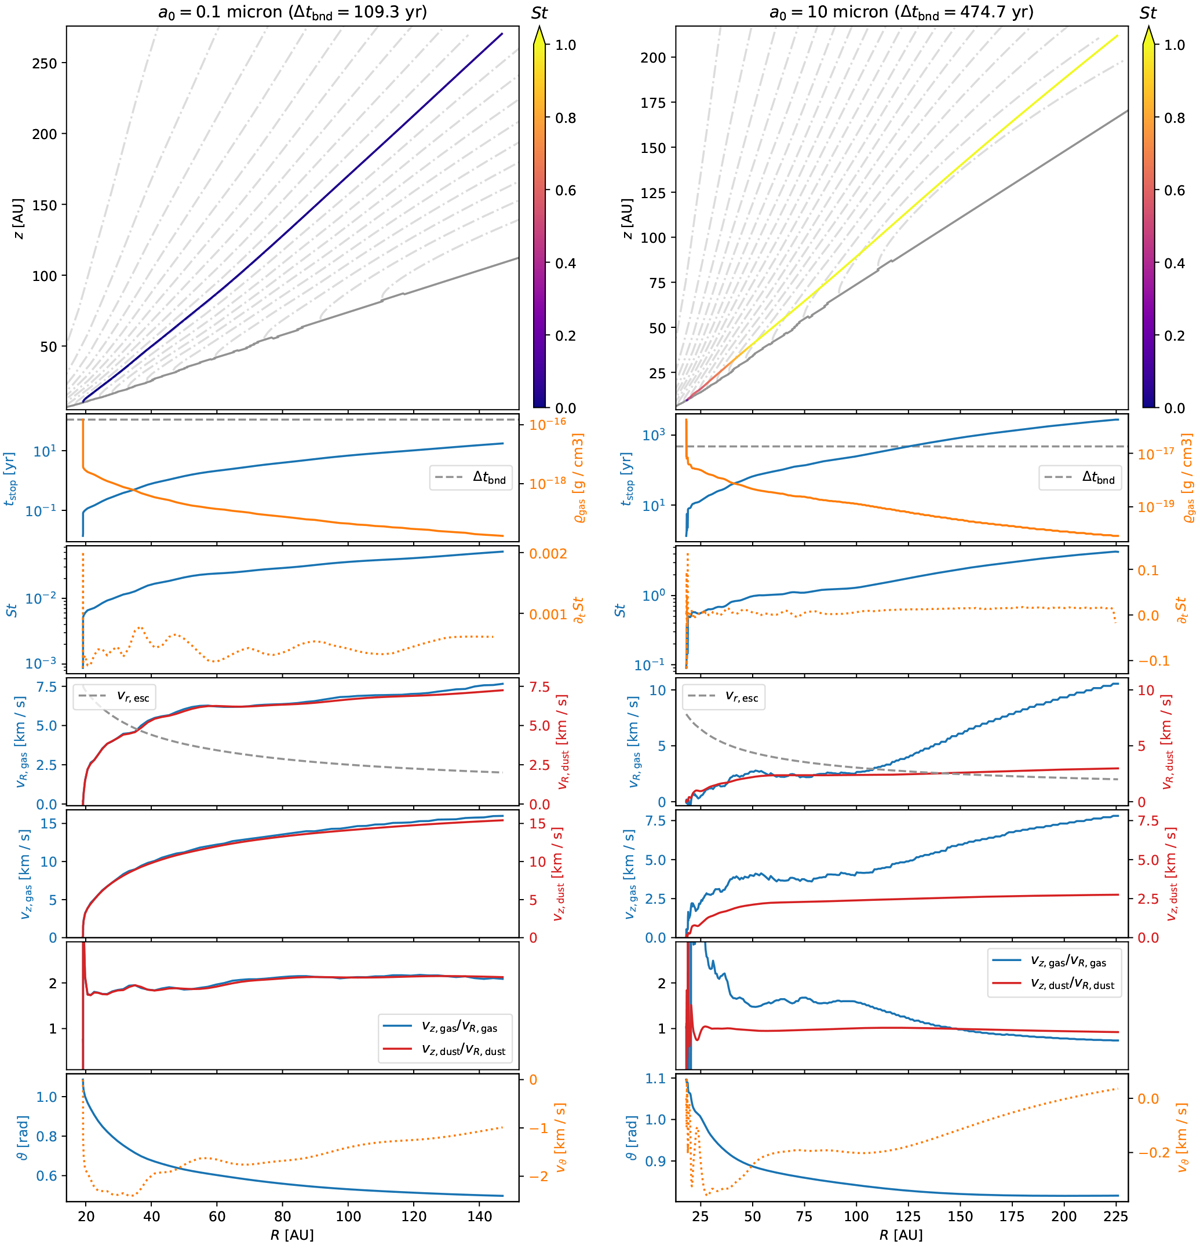
Analysis of two dust trajectories (left: a0 = 0.1 μm, right: a0 = 10 μm) entrained in the photoevaporative outflow from R ≃ 20 AU. Top panels: actual motion in the (R, z)-plane colored by St. Lower panels, from top to bottom: tstop and ϱgas, St and ∂t St, the horizontal speed vR of gas and dust, the vertical speed vz of gas and dust, a comparison of the direction of the motion vz∕vx for gas and dust, and ϑ and vϑ. See the text for an in-depth commentary.
Current usage metrics show cumulative count of Article Views (full-text article views including HTML views, PDF and ePub downloads, according to the available data) and Abstracts Views on Vision4Press platform.
Data correspond to usage on the plateform after 2015. The current usage metrics is available 48-96 hours after online publication and is updated daily on week days.
Initial download of the metrics may take a while.