Fig. A.1
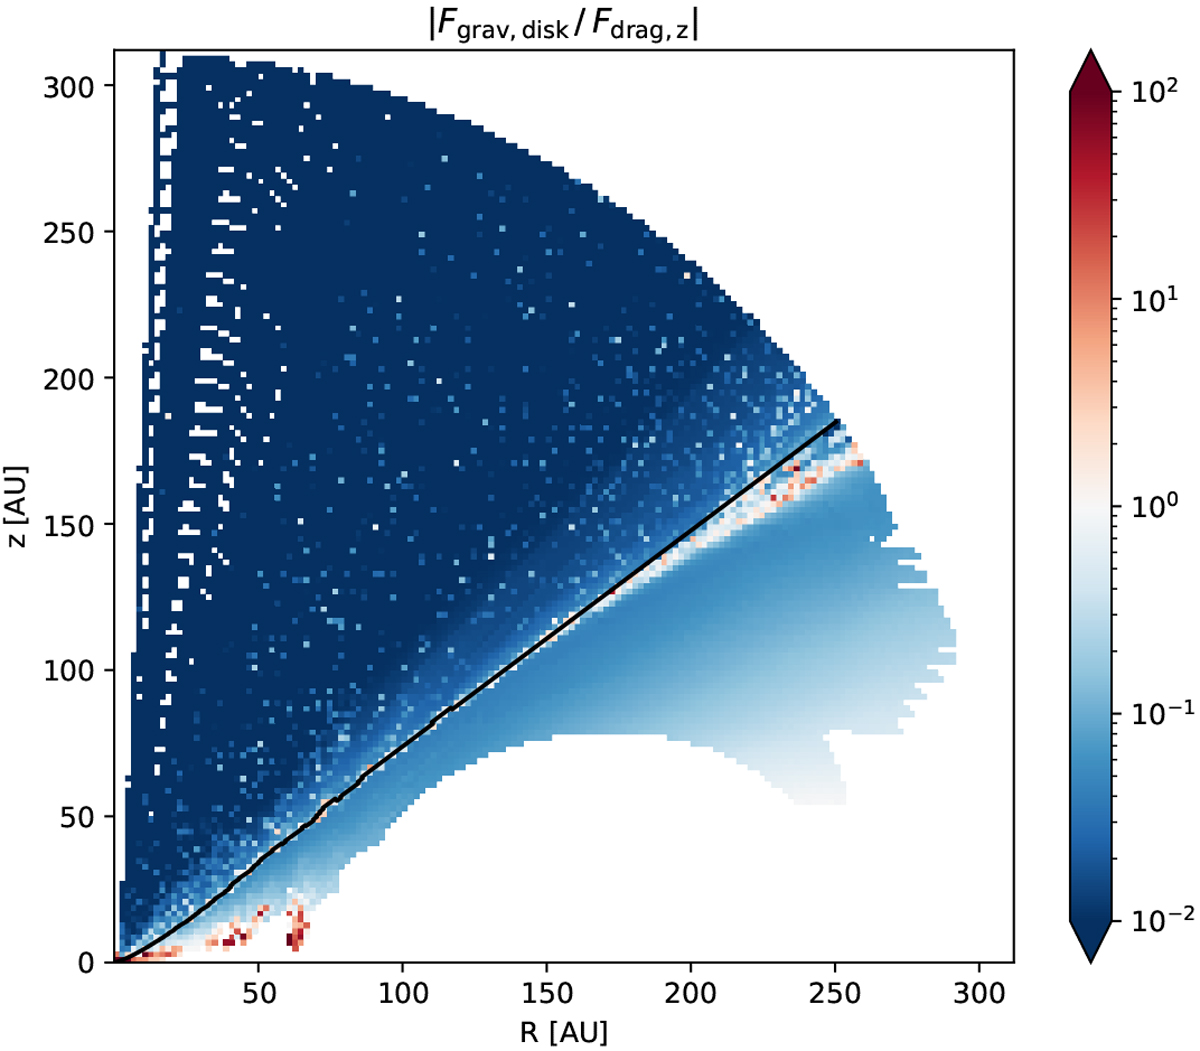
Maximum of the per-a0 mean values for |Fdisk,z∕Fdrag,z| (see colorbar), mapped to a 2 AU × 2 AU grid. The gas drag clearly dominates over the (overestimated) disk gravity, especially in the wind region (base of the wind in black). Empty (white) regions above the sonic surface indicate that no particle has been recorded while in this cell, owing to the high grain speeds there (in contrast to Sect. 3, we did not interpolate between recorded particle positions).
Current usage metrics show cumulative count of Article Views (full-text article views including HTML views, PDF and ePub downloads, according to the available data) and Abstracts Views on Vision4Press platform.
Data correspond to usage on the plateform after 2015. The current usage metrics is available 48-96 hours after online publication and is updated daily on week days.
Initial download of the metrics may take a while.