Fig. 10
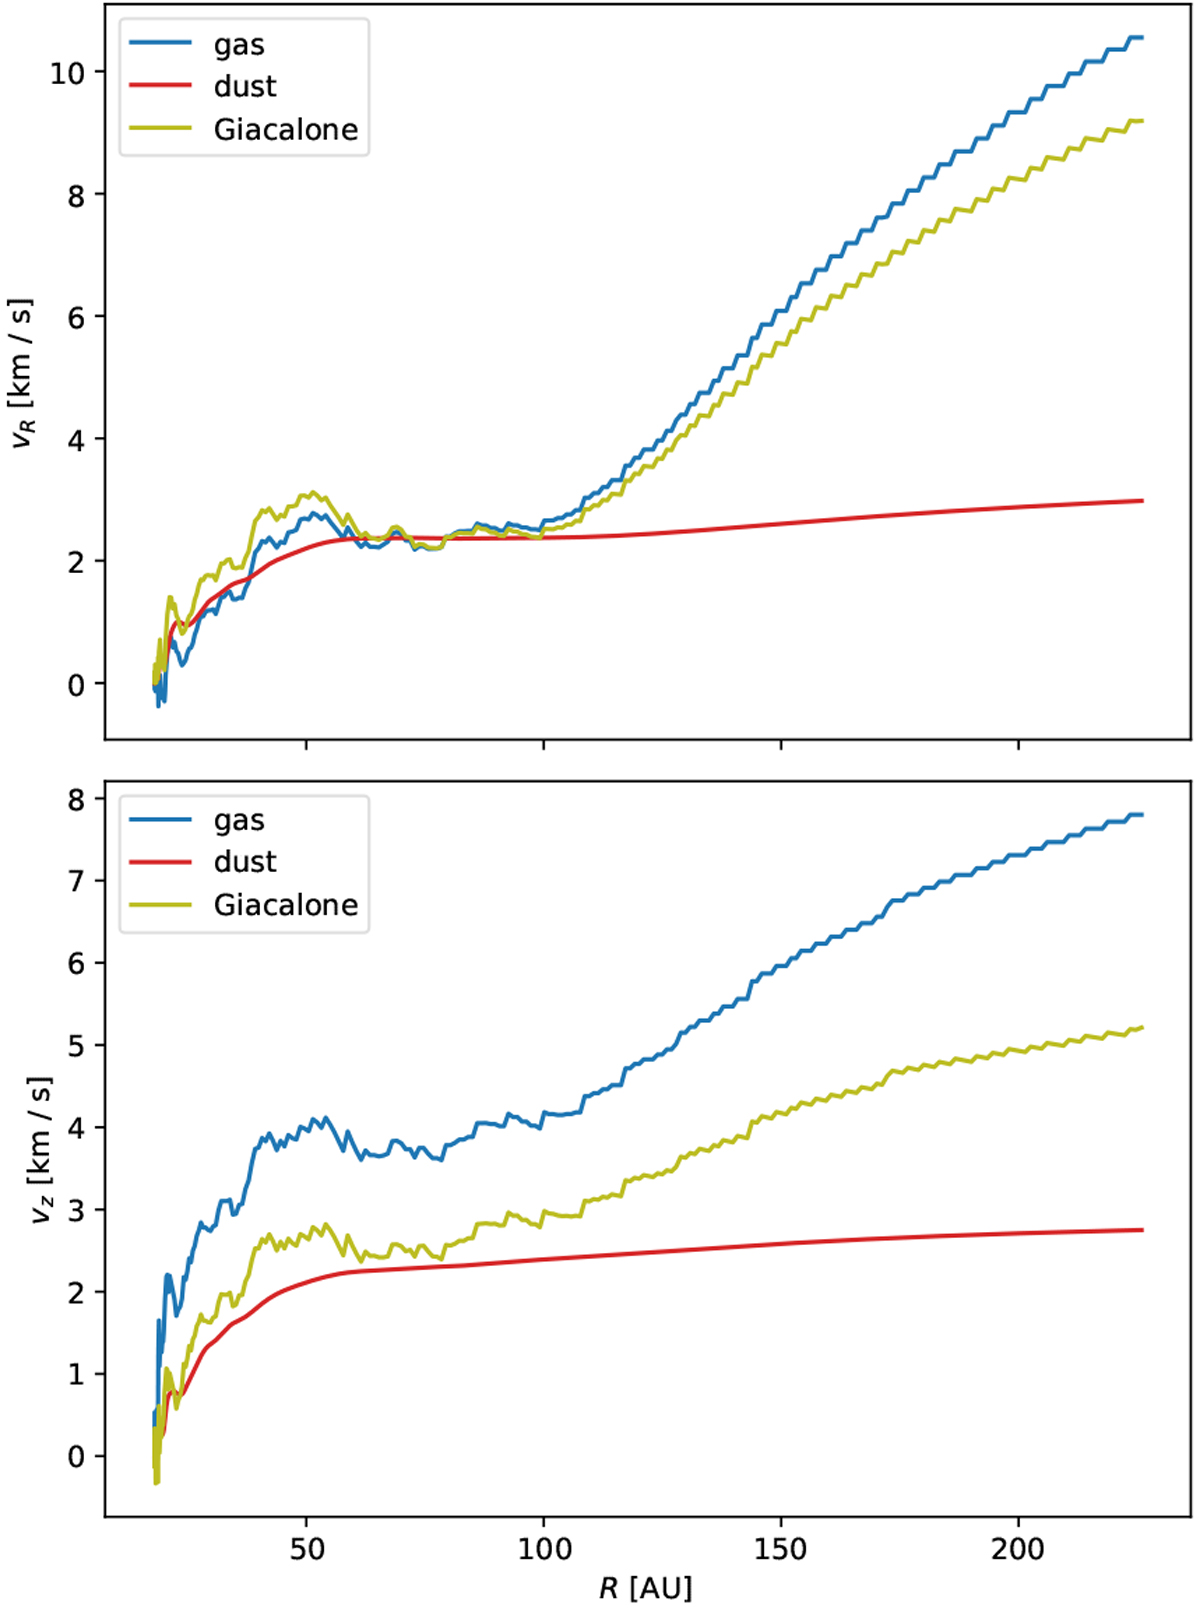
Re-plot of vR and vz for the same dust grain as in the right column of Fig. 4 (a0 = 10 μm). The dust parameters are colored red, the surrounding gas in blue; the motion according to Eqs. (1) and (3) of Giacalone et al. (2019), with tstop as retrieved from our model, is added in green. Especially towards larger R, the semi-analytical prescription does not reproduce the dust motion very well. It should be noted, however, that Giacalone et al. (2019) do not use it for grains this big.
Current usage metrics show cumulative count of Article Views (full-text article views including HTML views, PDF and ePub downloads, according to the available data) and Abstracts Views on Vision4Press platform.
Data correspond to usage on the plateform after 2015. The current usage metrics is available 48-96 hours after online publication and is updated daily on week days.
Initial download of the metrics may take a while.