Fig. 1
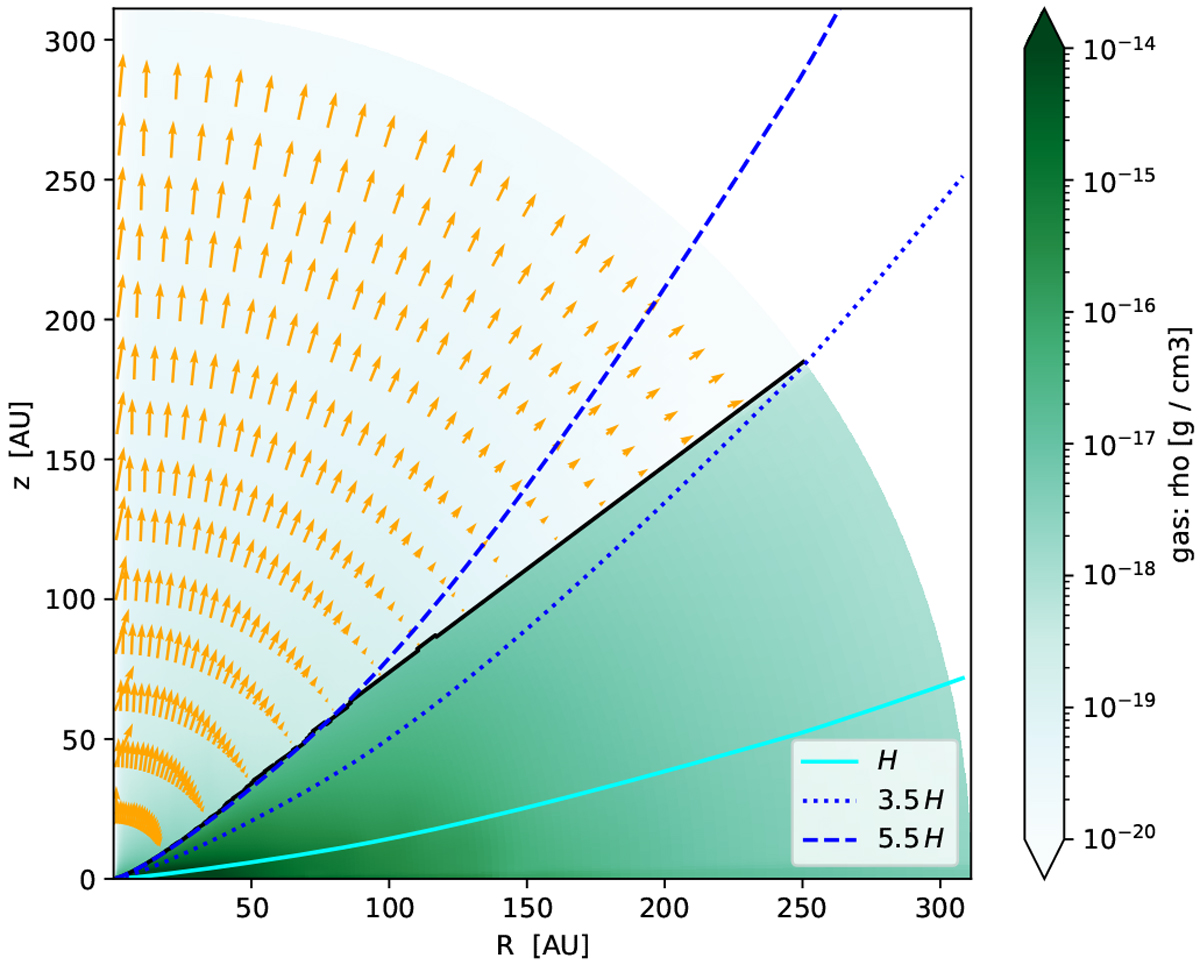
Density (green) and velocity map (yellow arrows: v) of the gas disk model from Picogna et al. (2019). The base of the XEUV flow (i.e. the location of the largest gradient in temperature) is shown in black, and coincides with a strong drop in density. vr is pointing radially outwards everywhere in the wind but very close to the sonic surface where v points outwards, but away from the disk (for R < 200 AU). The cyan line represents z(R) = H; additional lines for 3.5 H (dotted blue) and 5.5 H (dashed blue) show the range of scale heights the disk surface covers.
Current usage metrics show cumulative count of Article Views (full-text article views including HTML views, PDF and ePub downloads, according to the available data) and Abstracts Views on Vision4Press platform.
Data correspond to usage on the plateform after 2015. The current usage metrics is available 48-96 hours after online publication and is updated daily on week days.
Initial download of the metrics may take a while.