Fig. 9
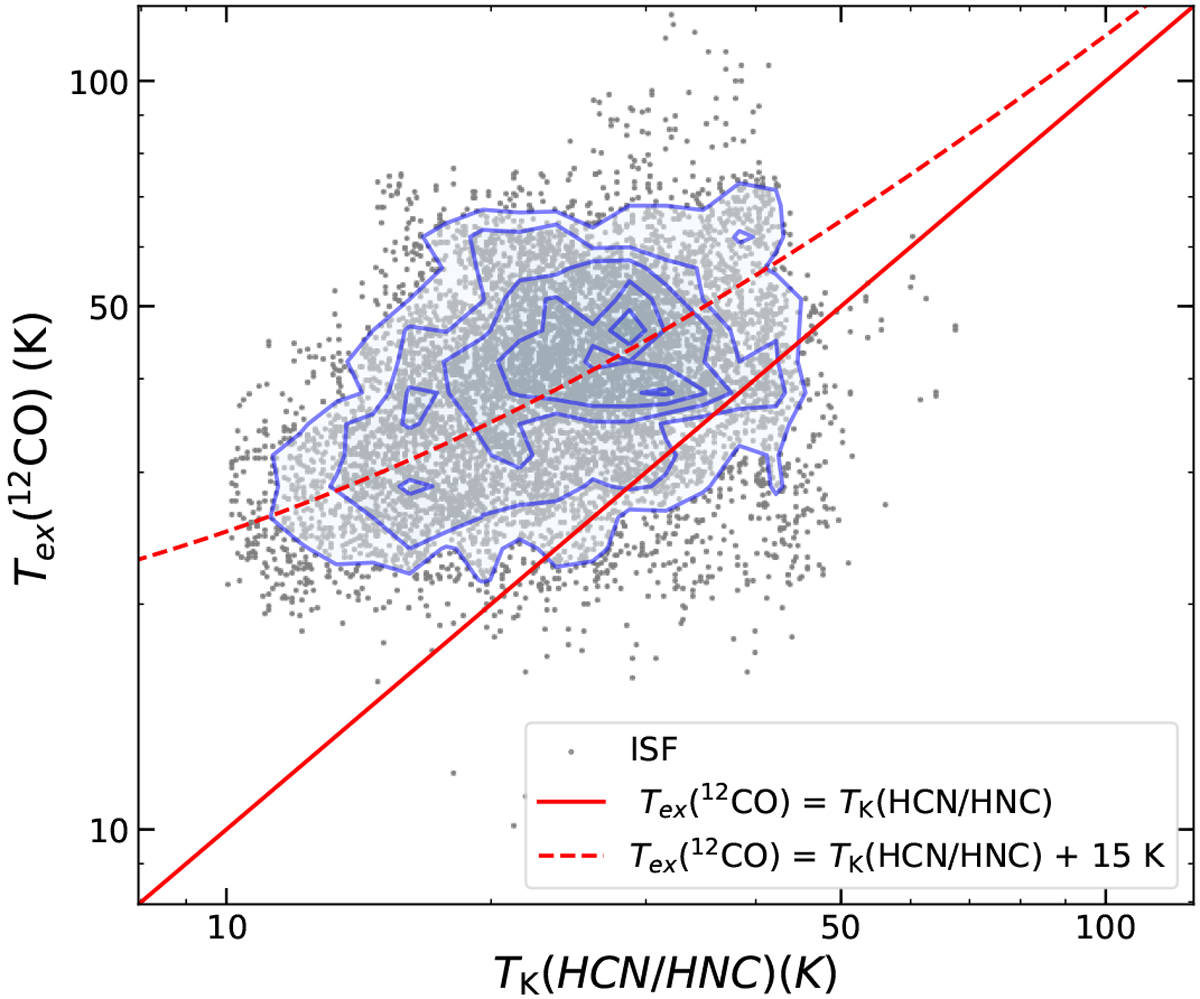
Comparison between our new TK(HCN/HNC) temperature estimates and the 12CO (1–0) excitation temperatures ![]() (Nakamura et al. 2012; Shimajiri et al. 2014) in all positions throughout the ISF outside the ONC nebula Orion HII nebula (i.e., I(H41α) ≤ 1.0 K km s−1; grey dots). The solid line indicates the linear correlation between these two temperatures estimates
(Nakamura et al. 2012; Shimajiri et al. 2014) in all positions throughout the ISF outside the ONC nebula Orion HII nebula (i.e., I(H41α) ≤ 1.0 K km s−1; grey dots). The solid line indicates the linear correlation between these two temperatures estimates ![]() = TK(HCN/HNC). Although they are positively correlated (see density contours in blue), we note that the
= TK(HCN/HNC). Although they are positively correlated (see density contours in blue), we note that the ![]() temperature estimates are systematically higher than the corresponding TK(HCN/HNC) values at the same position. For illustrative purposes we display the
temperature estimates are systematically higher than the corresponding TK(HCN/HNC) values at the same position. For illustrative purposes we display the ![]() (HCN/HNC)+15 K line denotedby a dashed red line in our plot.
(HCN/HNC)+15 K line denotedby a dashed red line in our plot.
Current usage metrics show cumulative count of Article Views (full-text article views including HTML views, PDF and ePub downloads, according to the available data) and Abstracts Views on Vision4Press platform.
Data correspond to usage on the plateform after 2015. The current usage metrics is available 48-96 hours after online publication and is updated daily on week days.
Initial download of the metrics may take a while.