Fig. 8
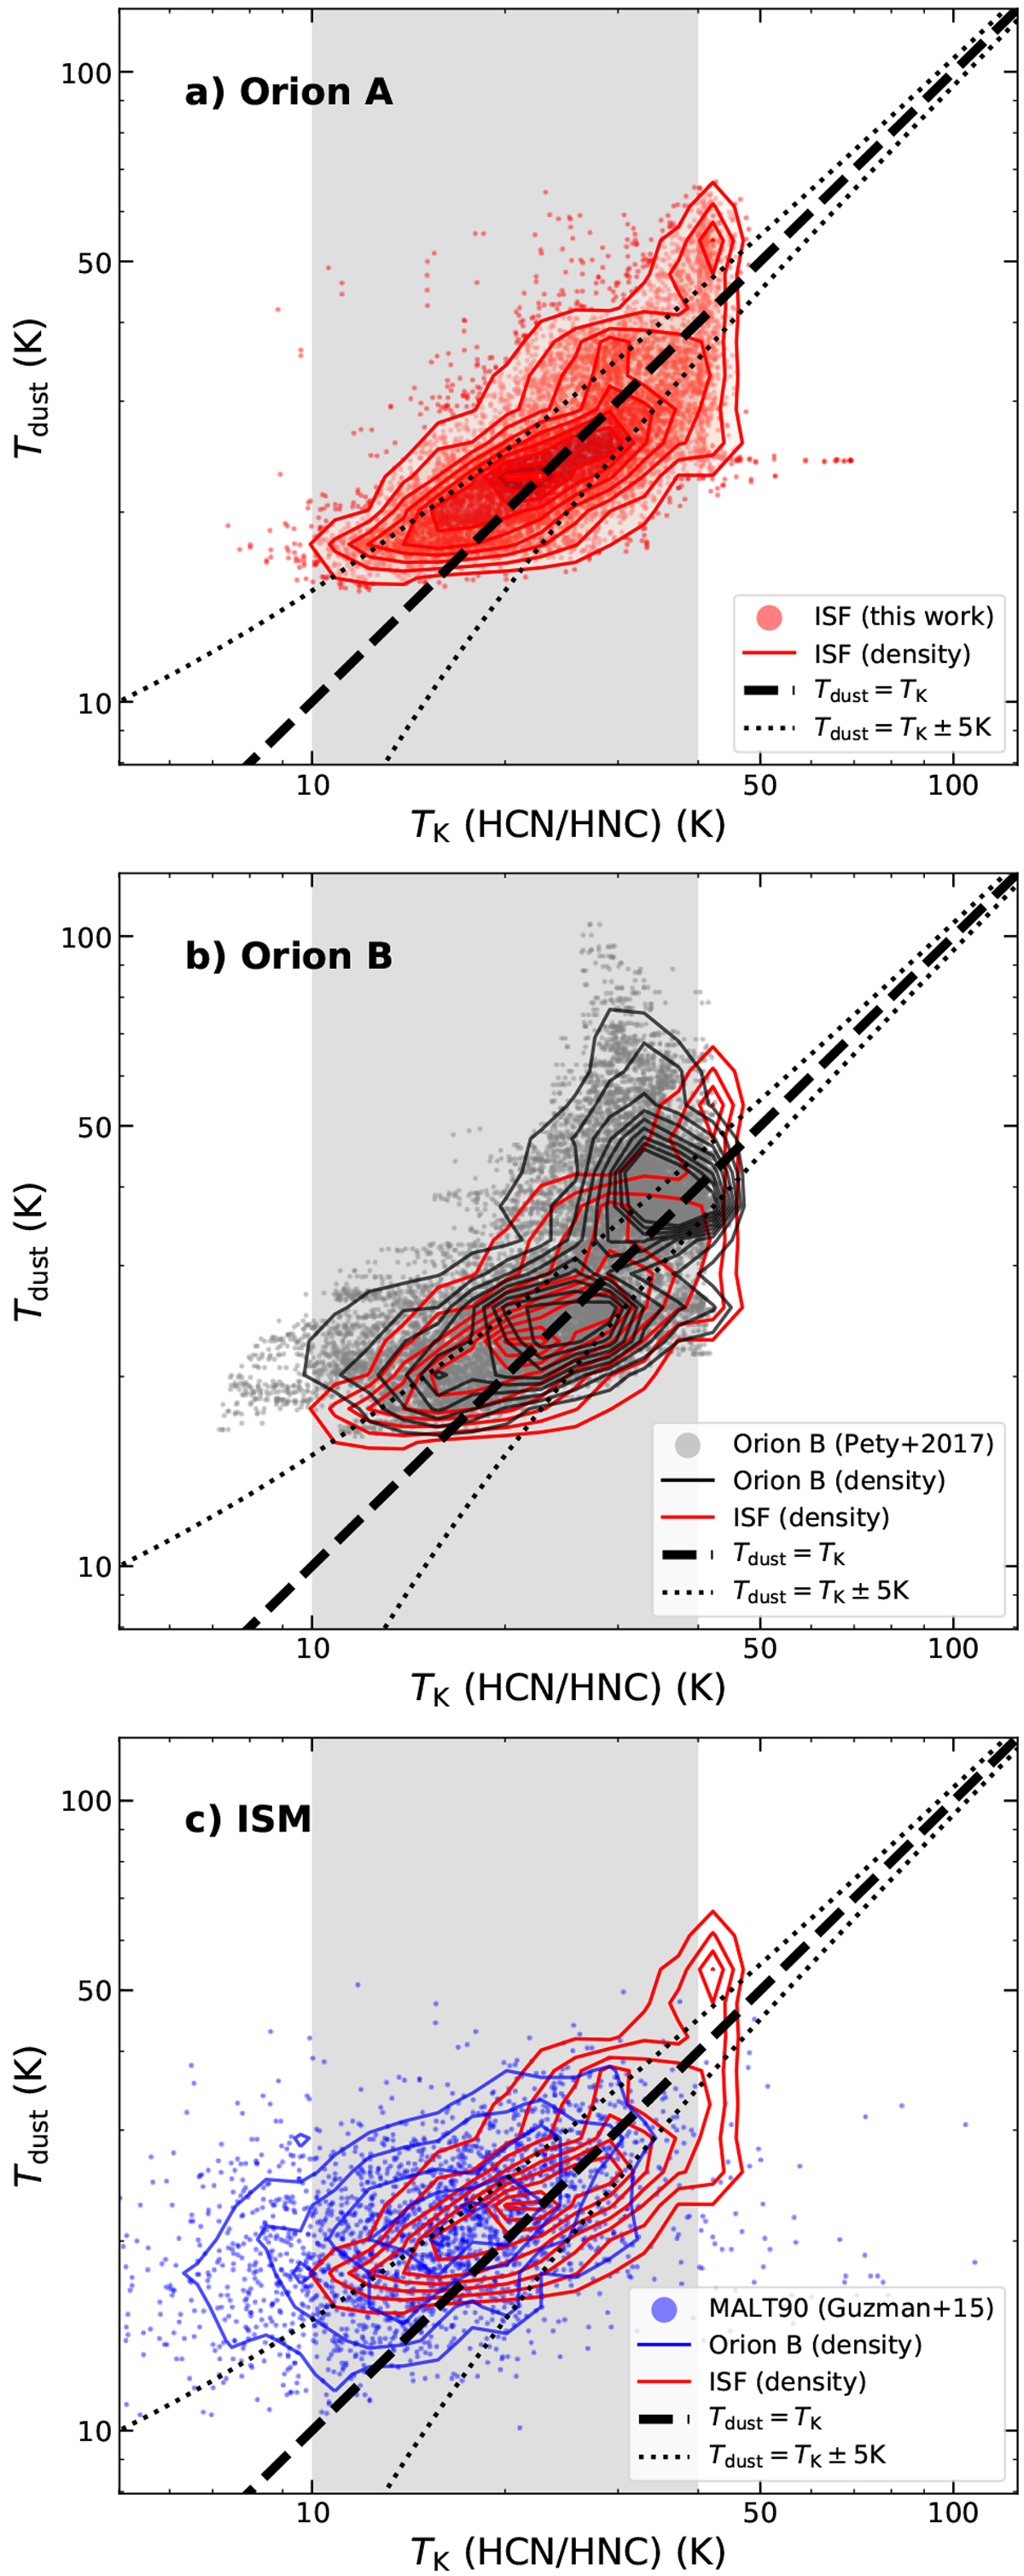
Comparison between the TK(HCN/HNC) gas kinetictemperatures predicted by our empirical method and the observed dust temperatures in different environments and surveys: (a) Orion ISF (this work), (b) Orion B (Pety et al. 2017), and (c) MALT90 sample (Foster et al. 2011, 2013; Jackson et al. 2013; Guzmán et al. 2015). We indicate the direct TK = Tdust (dashed line) and TK = Tdust ± 5 (dotted lines) correlations in all panels. The optimal temperature range for the application of our method, between ~[10 and 40] K, is highlighted in grey in all panels.
Current usage metrics show cumulative count of Article Views (full-text article views including HTML views, PDF and ePub downloads, according to the available data) and Abstracts Views on Vision4Press platform.
Data correspond to usage on the plateform after 2015. The current usage metrics is available 48-96 hours after online publication and is updated daily on week days.
Initial download of the metrics may take a while.