Fig. 7
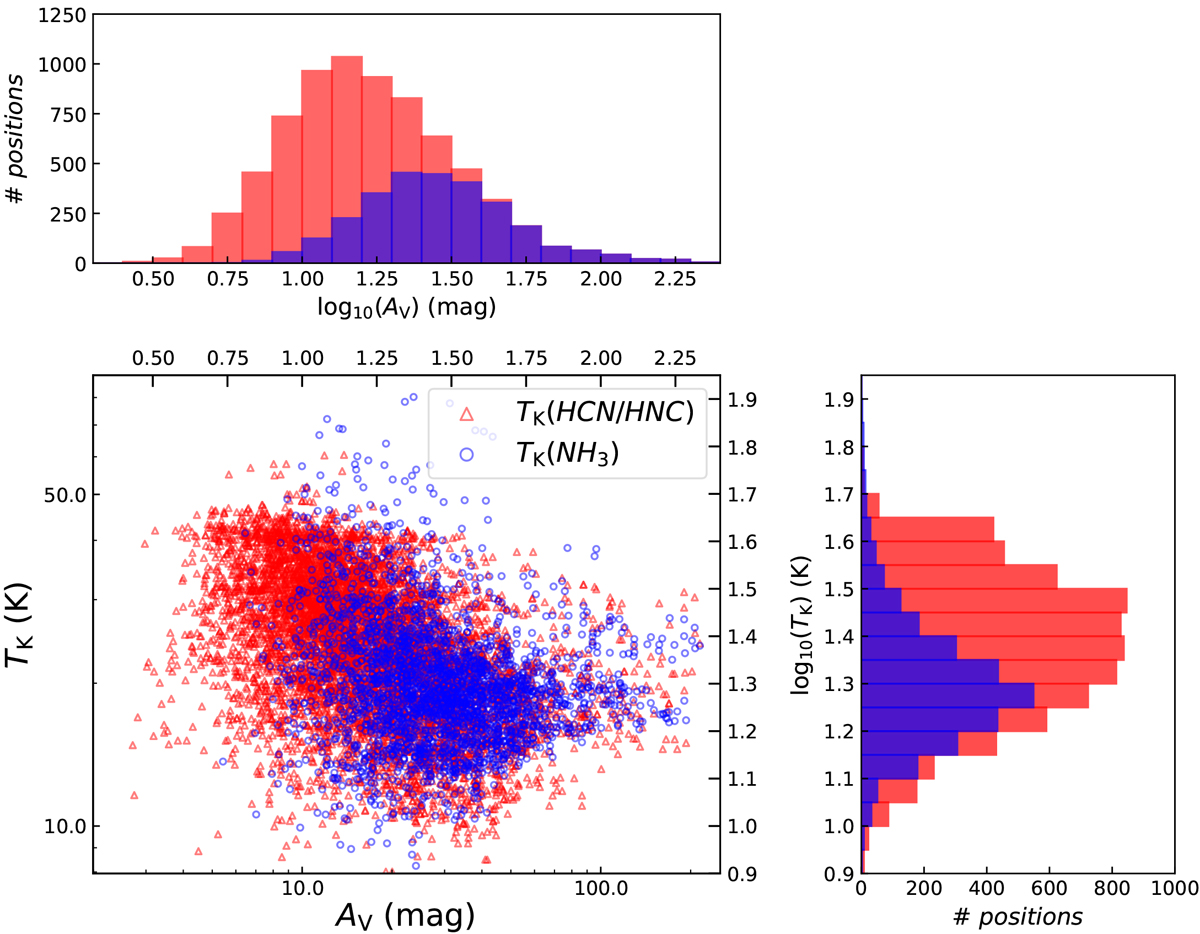
Central panel: gas kinetic temperatures derived using both TK(HCN/HNC) (red triangles) and TK(NH3) estimatesas function of total gas column density (Lombardi et al. 2014) in the ISF region. For simplicity, we display only positions outside the Orion HII nebula (i.e., I(H41α) ≤ 1.0 K km s−1). Lateral panels: histograms for the distribution of the temperatures (right subpanel) and column densities (upper subpanel) traced by each of these TK(HCN,HNC) (red bars) and TK(NH3) (blue bars) measurements. Note that the histograms are binned in log-space.
Current usage metrics show cumulative count of Article Views (full-text article views including HTML views, PDF and ePub downloads, according to the available data) and Abstracts Views on Vision4Press platform.
Data correspond to usage on the plateform after 2015. The current usage metrics is available 48-96 hours after online publication and is updated daily on week days.
Initial download of the metrics may take a while.