Fig. 6
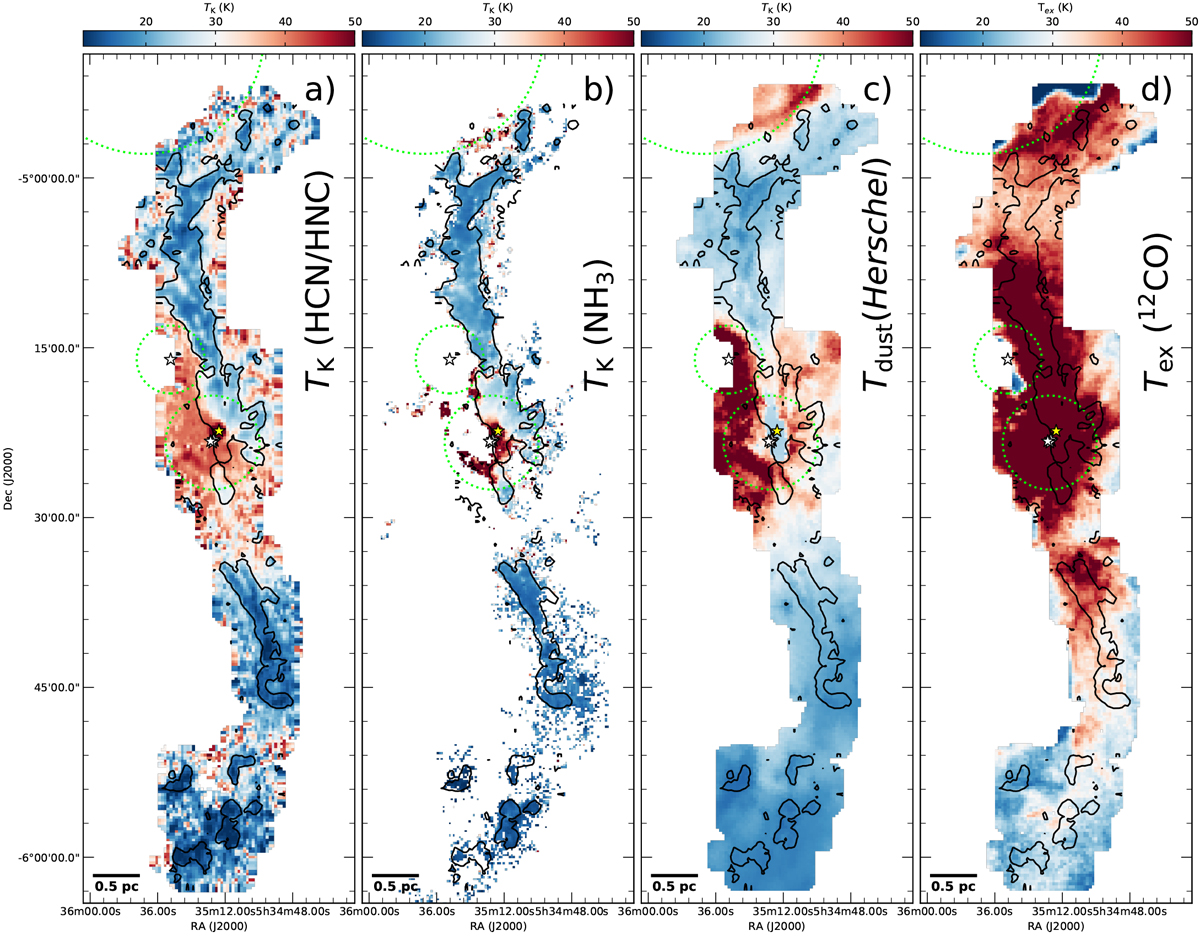
Comparison of different TK estimates along the ISF: (a) TK(HCN/HNC) (this work), (b) ammonia-derived gas kinetic temperatures TK(NH3) (Friesen et al. 2017), (c) Herschel dust temperatures Tdust (Lombardi et al. 2014), and (d) 12CO (1–0) excitation temperatures ![]() (Nakamura et al. 2012; Shimajiri et al. 2014), all represented with the same colour scale. We note that both dust temperature and column density are underestimated towards the OMC-1 and BN/KL regions as a result of saturation effects and the lack of proper SED fits in the Herschel maps provided by Lombardi et al. (2014). We also note the rapid decrease in Tex (CO) at the northern end in our maps, which is likely due to subthermal excitation of the 12CO (i.e.,
(Nakamura et al. 2012; Shimajiri et al. 2014), all represented with the same colour scale. We note that both dust temperature and column density are underestimated towards the OMC-1 and BN/KL regions as a result of saturation effects and the lack of proper SED fits in the Herschel maps provided by Lombardi et al. (2014). We also note the rapid decrease in Tex (CO) at the northern end in our maps, which is likely due to subthermal excitation of the 12CO (i.e., ![]() ) lines at the low densities expected in this region. To facilitate the comparison of these figure, we indicate the intensity contour withI(N2H+) = 1.5 K km s−1 in panels b–d. Circles and stars are similar to Fig. 1.
) lines at the low densities expected in this region. To facilitate the comparison of these figure, we indicate the intensity contour withI(N2H+) = 1.5 K km s−1 in panels b–d. Circles and stars are similar to Fig. 1.
Current usage metrics show cumulative count of Article Views (full-text article views including HTML views, PDF and ePub downloads, according to the available data) and Abstracts Views on Vision4Press platform.
Data correspond to usage on the plateform after 2015. The current usage metrics is available 48-96 hours after online publication and is updated daily on week days.
Initial download of the metrics may take a while.