Fig. 4
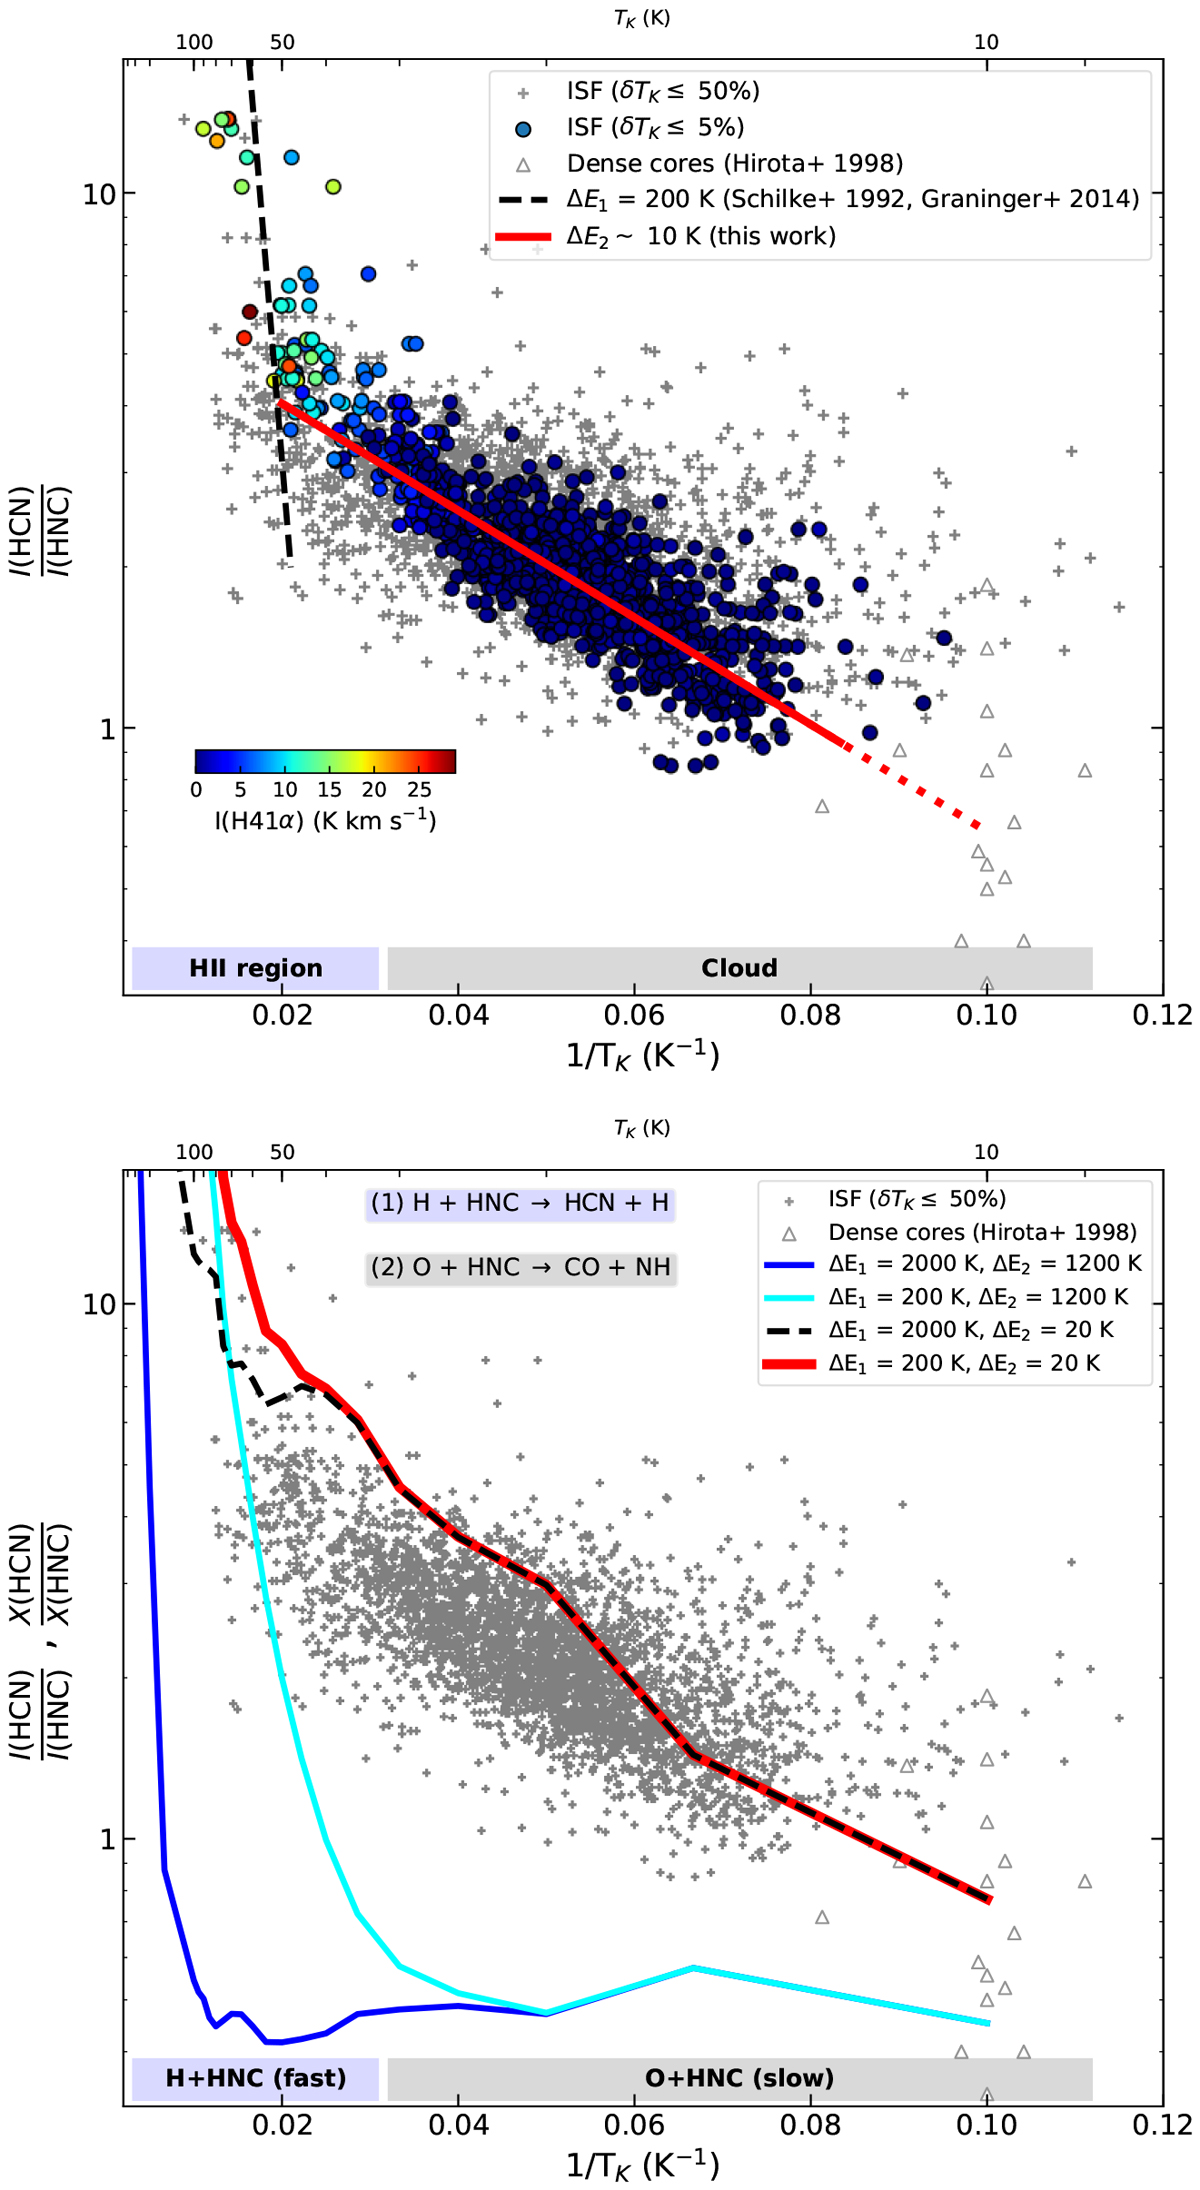
Upper panel: observed dependence of the I(HCN)∕I(HNC) intensity ratio as function of 1/TK in the ISF (grey crosses; this work) in comparison with classical estimates from dense core surveys (grey triangles; Hirota et al. 1998). The positions with good temperature estimates (i.e., δTK ∕TK ≤ 5%) are colour-coded according to their total H41α intensity (see Fig. 1). The temperature dependence of the I(HCN)∕I(HNC) expected for an energy barrier of ΔE1 = 200 K for reaction (1) is indicated by the black dashed line (Schilke et al. 1992; Graninger et al. 2014). Similarly, the newly proposed low energy barrier for ΔE2 = 10 K for reaction (2) is shown in red. Lower panel: X(HCN)∕X(HNC) abundance variations predicted by our models (1–4) with different energy barriers (see also text) compared to the observed intensity variations in cores (grey triangles) and throughout the ISF (grey crosses). Our model results illustrate the differentdominant roles of reactions (1) and (2) determining the temperature structure of the ONC (blue area) and the rest of the cloud (grey area). The detailed equivalence between the observed intensity ratios and the corresponding abundance ratios in our models are discussed in Appendix B.
Current usage metrics show cumulative count of Article Views (full-text article views including HTML views, PDF and ePub downloads, according to the available data) and Abstracts Views on Vision4Press platform.
Data correspond to usage on the plateform after 2015. The current usage metrics is available 48-96 hours after online publication and is updated daily on week days.
Initial download of the metrics may take a while.