Fig. 3
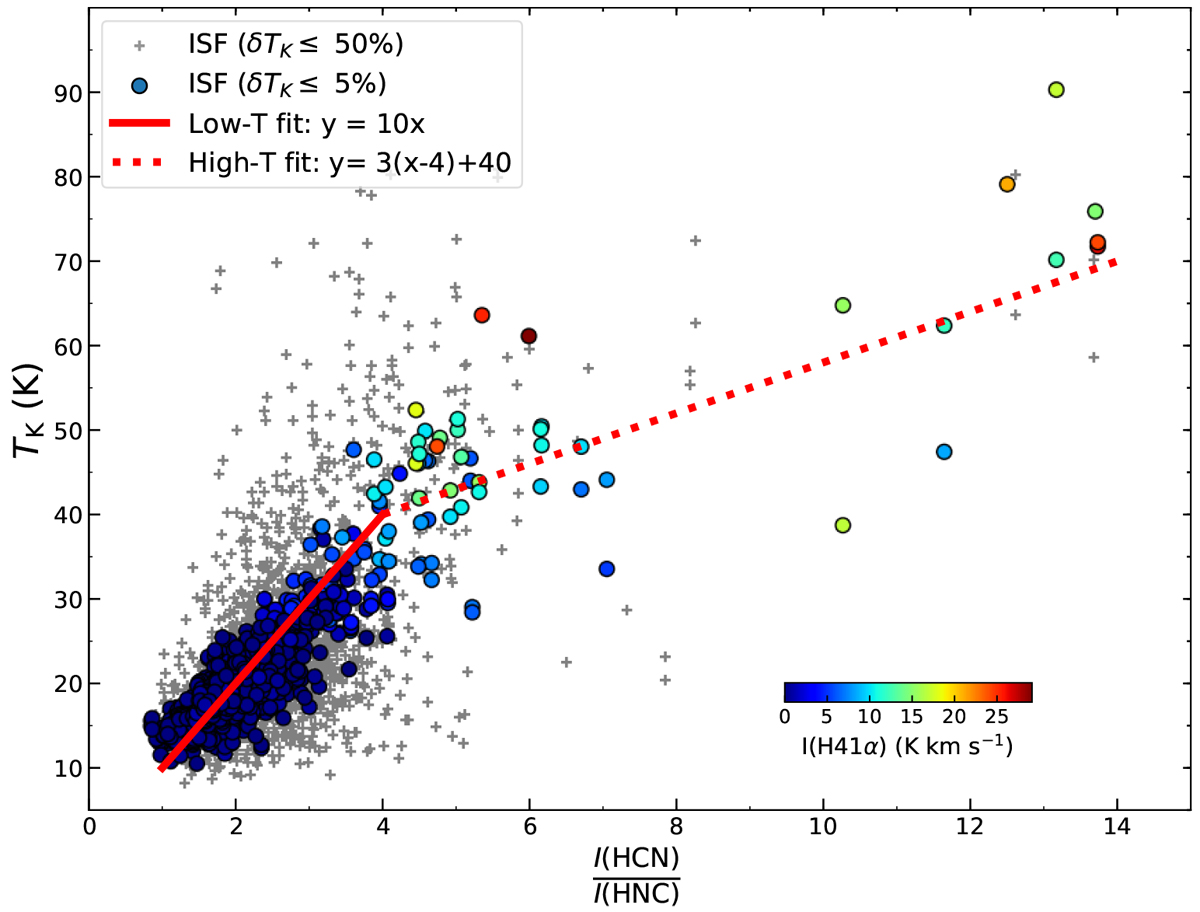
Correlation between the observed I(HCN)∕I(HNC) (this work) and measurements of the gas kinetic temperatures derived using NH3 observations(Friesen et al. 2017) with reliable temperature estimates (i.e. δTK∕TK ≤ 50%; grey crosses). These positions with good temperature estimates (i.e. δTK∕TK ≤ 5%) are colour-coded according to their total H41α intensity (see Fig. 1). A systematic increase in the gas kinetic temperatures in Orion is clearly visible in positions with strong I(H41α) emission, which denotes their proximity to the ONC. The empirical linear fit of each of the low- (solid red line) and high-(dotted red line) temperature regimes are indicated in the plot (see Sect. 4).
Current usage metrics show cumulative count of Article Views (full-text article views including HTML views, PDF and ePub downloads, according to the available data) and Abstracts Views on Vision4Press platform.
Data correspond to usage on the plateform after 2015. The current usage metrics is available 48-96 hours after online publication and is updated daily on week days.
Initial download of the metrics may take a while.