Fig. 2
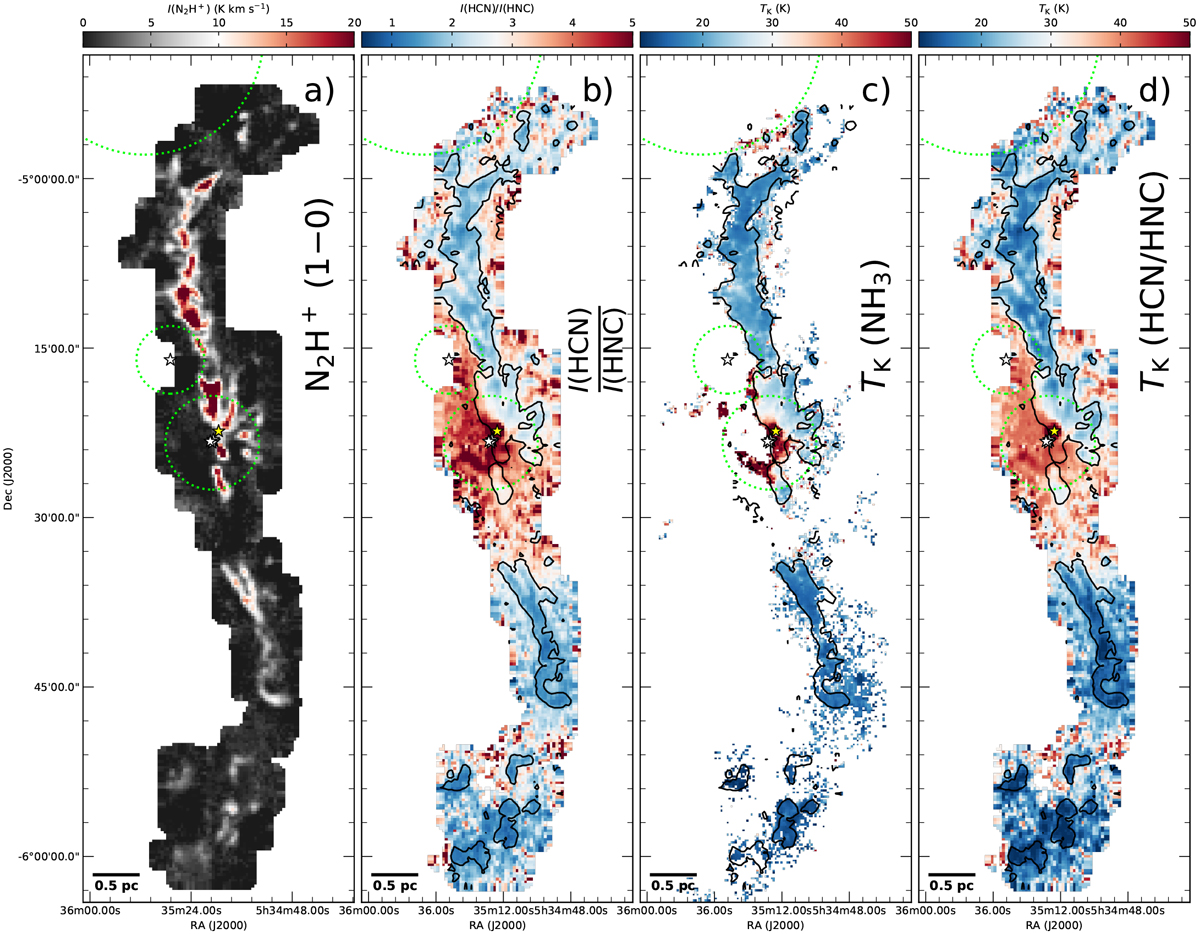
From left to right: (a) N2H+ (1–0) integrated emission (see also Hacar et al. 2017a), (b) I(HCN)-to-I(HNC) line intensity ratio (see also Fig. 1), (c) gas kinetic temperature map derived using NH3 measurements (Friesen et al. 2017), and (d) gas kinetic temperature map derived using the proposed I(HCN) ∕I(HNC) as a temperature probe according to Eqs. (3) and (4) (this work). For comparison, we indicate the intensity contour with I(N2H+) = 1.5 K km s−1 in panels b–d. Circles and stars are similar to Fig. 1.
Current usage metrics show cumulative count of Article Views (full-text article views including HTML views, PDF and ePub downloads, according to the available data) and Abstracts Views on Vision4Press platform.
Data correspond to usage on the plateform after 2015. The current usage metrics is available 48-96 hours after online publication and is updated daily on week days.
Initial download of the metrics may take a while.