Fig. B.1
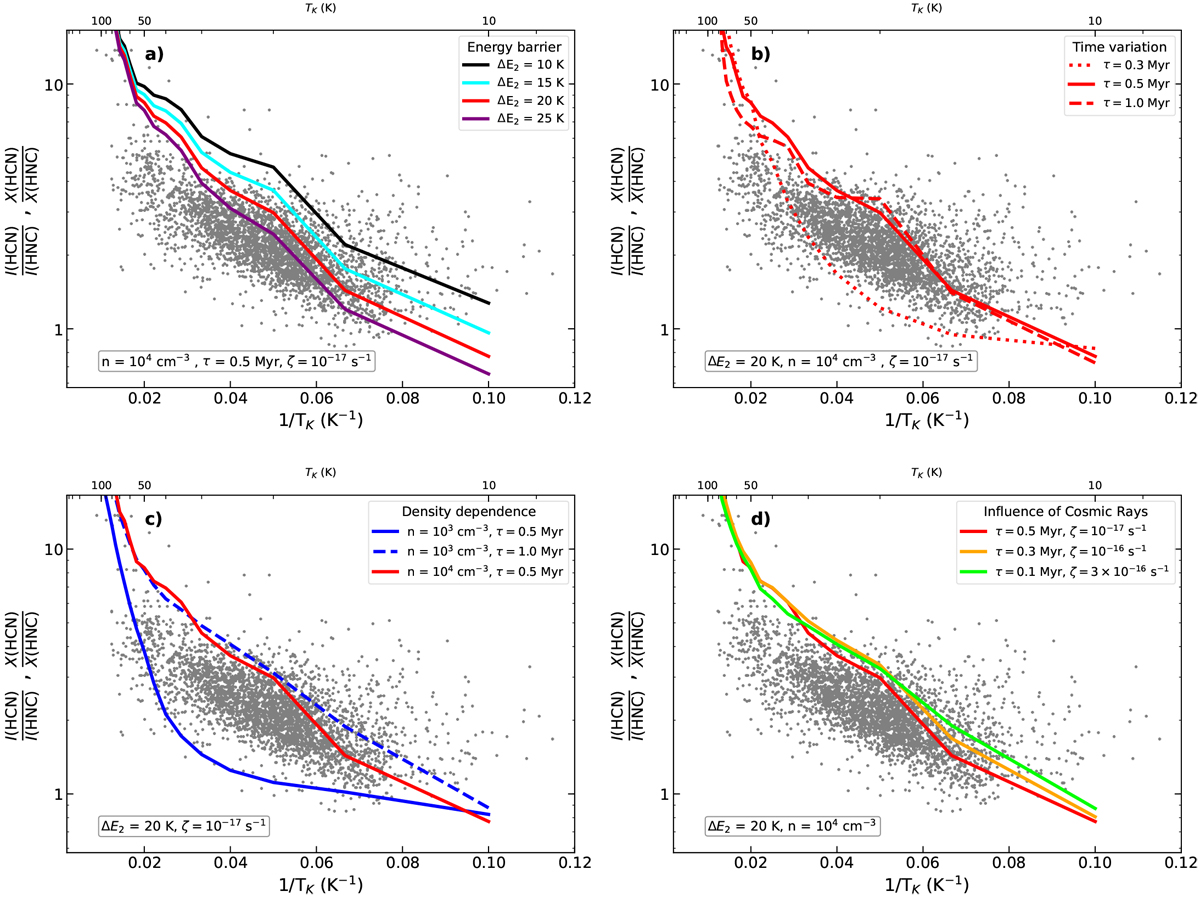
Predicted HCN and HNC abundances as a function of 1/TK for different input parameters in our models. Data points and axes are similar to Fig. 4 b. From left to right and from top to bottom: model results for independent variations of the (a) energy barrier for reaction (2) (ΔE2), (b) time evolution (τ), (c) gas density (n(H2)), and (d) cosmic-ray ionization rate (ζ). The input values of these models are listed and colour-coded in each plot in the upper right corner of each subplot. Similarly, all fixed parameters for each of these comparisons are indicated in the lower left corner. These results are compared to our fiducial model assuming ΔE1 = 200 K, ΔE2 = 20 K, τ = 0.5 Myr, n(H2) = 104 cm−3, and ζ = 10−17 s−1 (red solid line in all subplots).
Current usage metrics show cumulative count of Article Views (full-text article views including HTML views, PDF and ePub downloads, according to the available data) and Abstracts Views on Vision4Press platform.
Data correspond to usage on the plateform after 2015. The current usage metrics is available 48-96 hours after online publication and is updated daily on week days.
Initial download of the metrics may take a while.