Fig. A.1
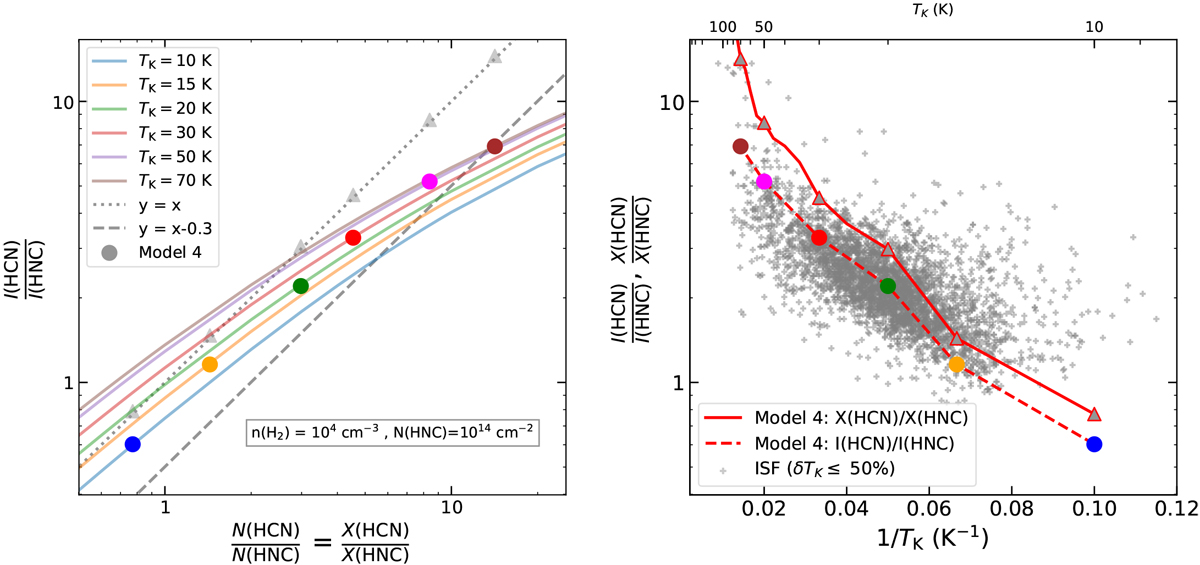
Comparison between the HCN vs. HNC intensity ratio (L(HCN)∕L(HNC)) as function of the abundance ratio (X(HCN)∕X(HNC)) for different gas kinetic temperatures (TK). Left: luminosity variations for N(HCN)∕N(HNC) = X(HCN)∕X(HNC) = [0.1, 100] for gas temperatures between 10 and 70 K (coloured lines) calculated using RADEX assuming n(H2) = 104 cm−3 and N(HNC) = 1014 cm−2 (see text). Linear variations are indicated by dotted (x = y) and dashed (y = x–0.3 dex) lines. The abundance and intensity ratios expected for our model 4 are indicated by solid circles coloured according to their corresponding temperature. Right: differences between the predicted X(HCN)∕X(HNC) (solid line) and L(HCN)∕L(HNC) (dashed line) values for model 4 as a function of 1/TK (solid circles; similar to the left panel) in comparison to our Orion observations (grey crosses), similar to Fig. 5. We note the close correspondence between these X(HCN)∕X(HNC) and L(HCN)∕L(HNC) measurements under the physical conditions considered in our models.
Current usage metrics show cumulative count of Article Views (full-text article views including HTML views, PDF and ePub downloads, according to the available data) and Abstracts Views on Vision4Press platform.
Data correspond to usage on the plateform after 2015. The current usage metrics is available 48-96 hours after online publication and is updated daily on week days.
Initial download of the metrics may take a while.