Fig. 11
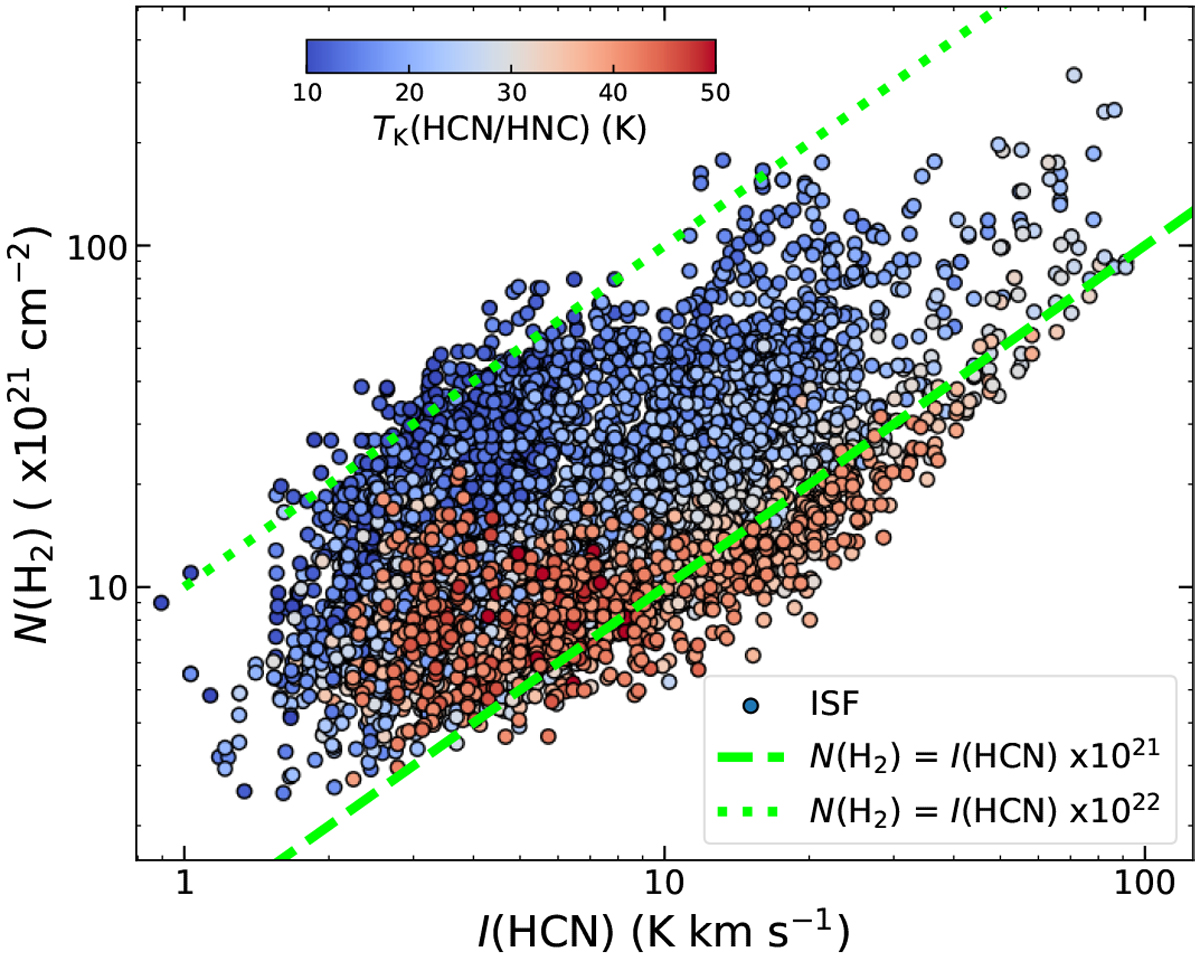
Correlation between the observed total HCN intensities I(HCN) and the totalgas column density N(H2) for all positions in our maps, colour-coded by their gas kinetic temperature (see scale bar in the top left corner). We note the large spread in our data (up to 1 dex) for a given column density N(H2) or intensity I(HCN) value.
Current usage metrics show cumulative count of Article Views (full-text article views including HTML views, PDF and ePub downloads, according to the available data) and Abstracts Views on Vision4Press platform.
Data correspond to usage on the plateform after 2015. The current usage metrics is available 48-96 hours after online publication and is updated daily on week days.
Initial download of the metrics may take a while.