Fig. 10
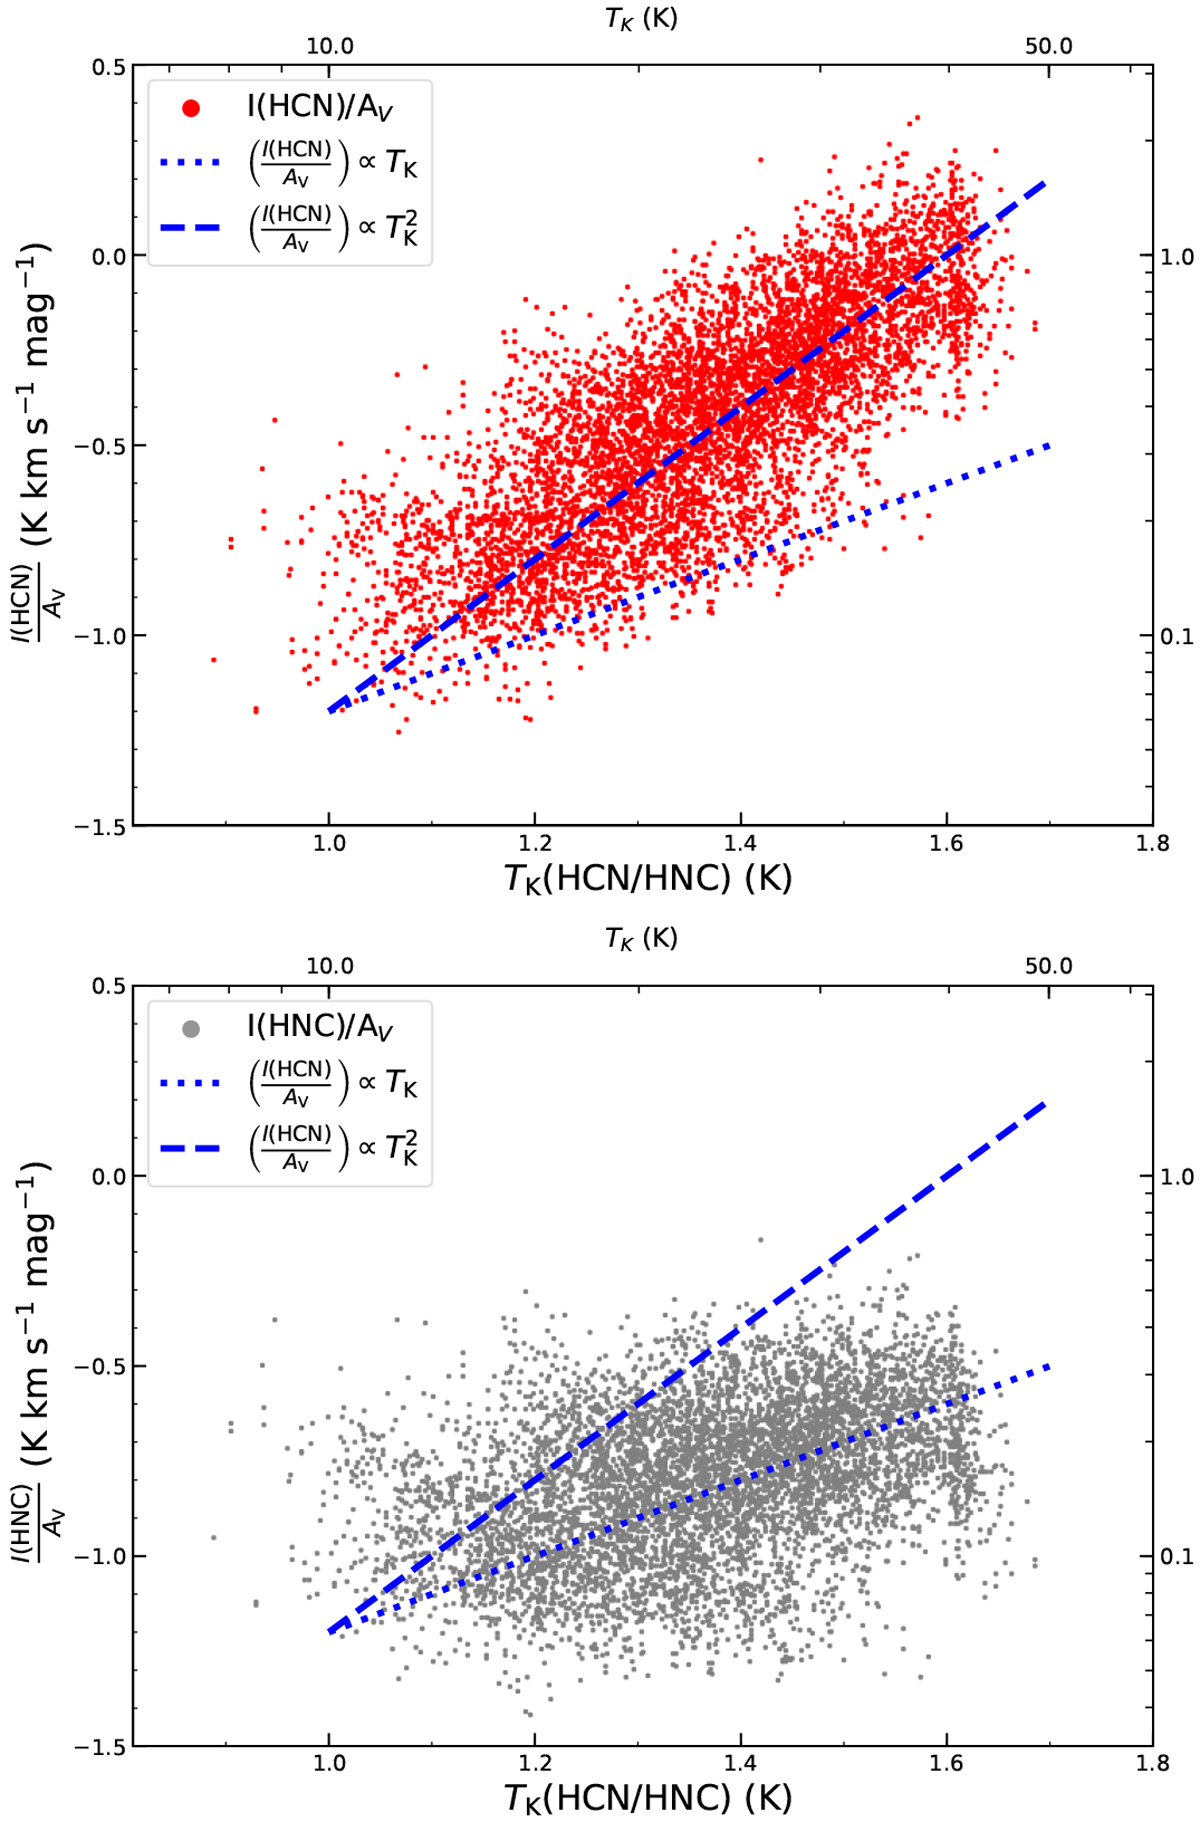
Specific HCN (top) and HNC (bottom) intensities normalized by column density (i.e., I(X)/AV) as function of the TK(HCN/HNC) gas temperatures for all positions in our ISF maps with I(HCN), I(HNC) ≥ 1.0 K km s−1 outside the ONC, that is, with I(H41α) ≤ 1.0 K km s−1. For comparison, linear (blue dotted line) and quadratic (blue dashed line) variations of the normalized line intensities with temperature are indicated in all subpanels.
Current usage metrics show cumulative count of Article Views (full-text article views including HTML views, PDF and ePub downloads, according to the available data) and Abstracts Views on Vision4Press platform.
Data correspond to usage on the plateform after 2015. The current usage metrics is available 48-96 hours after online publication and is updated daily on week days.
Initial download of the metrics may take a while.