Fig. 1
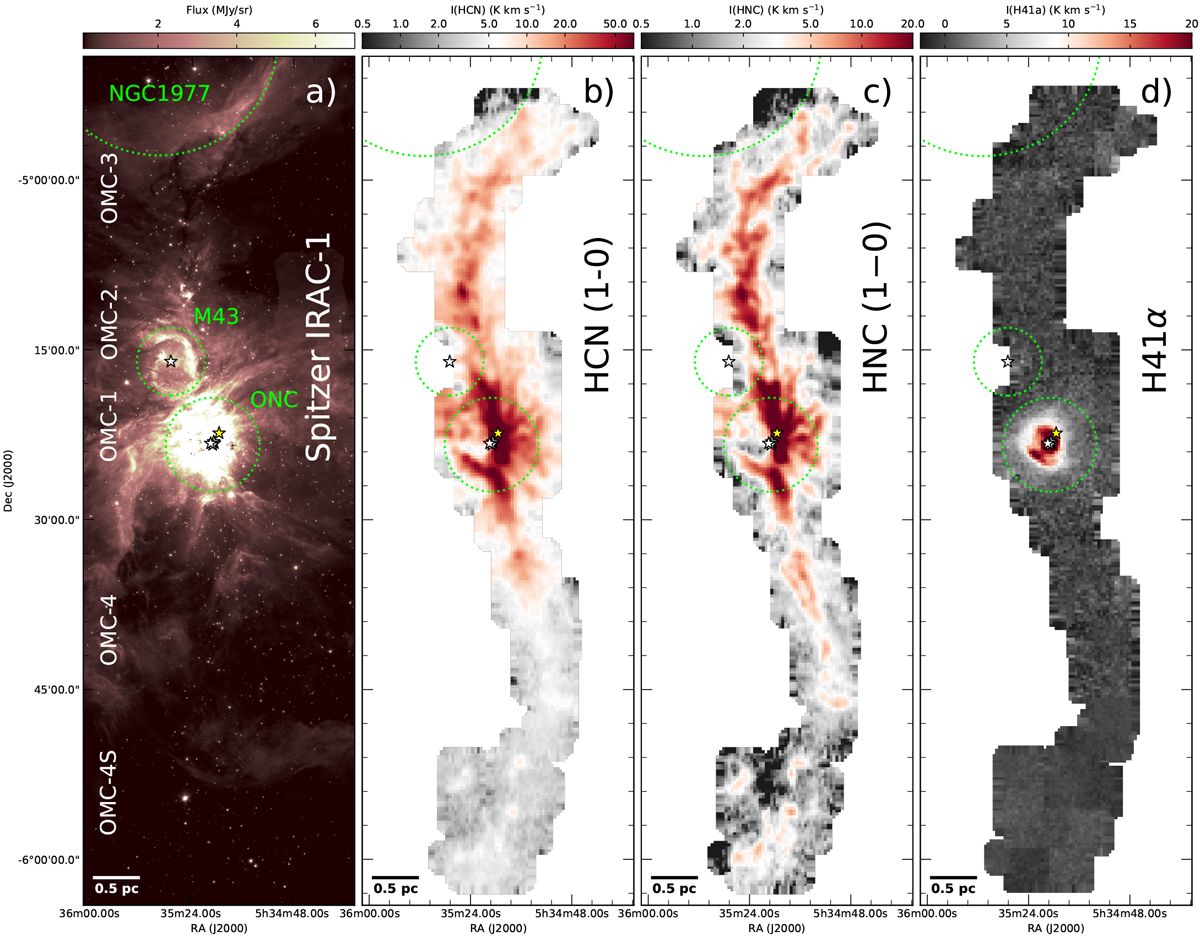
New IRAM 30 m observations throughout the Orion ISF. From left to right: (a) Spitzer IRAC-1 emission map (Megeath et al. 2012); (b) HCN (J = 1–0), (c) HNC (J = 1–0), and (d) H41α line intensity (also known as total integrated intensity) maps (this work). We note that both HCN and HNC intensity maps are presented in logarithmic scales because of the wide dynamic range in emission that these two species show. The different OMC 1-4 clouds, together with the different clusters and nebulosities, are indicated in the IRAC-1 image. For guidance, the extension of the ONC, M43, and NGC1977 regions (green dotted circles), as well the position of the Trapezium and NU Ori stars (white stars) plus the Orion BN source (yellow star), are also indicated in the different IRAM 30 m maps.
Current usage metrics show cumulative count of Article Views (full-text article views including HTML views, PDF and ePub downloads, according to the available data) and Abstracts Views on Vision4Press platform.
Data correspond to usage on the plateform after 2015. The current usage metrics is available 48-96 hours after online publication and is updated daily on week days.
Initial download of the metrics may take a while.