Fig. 5.
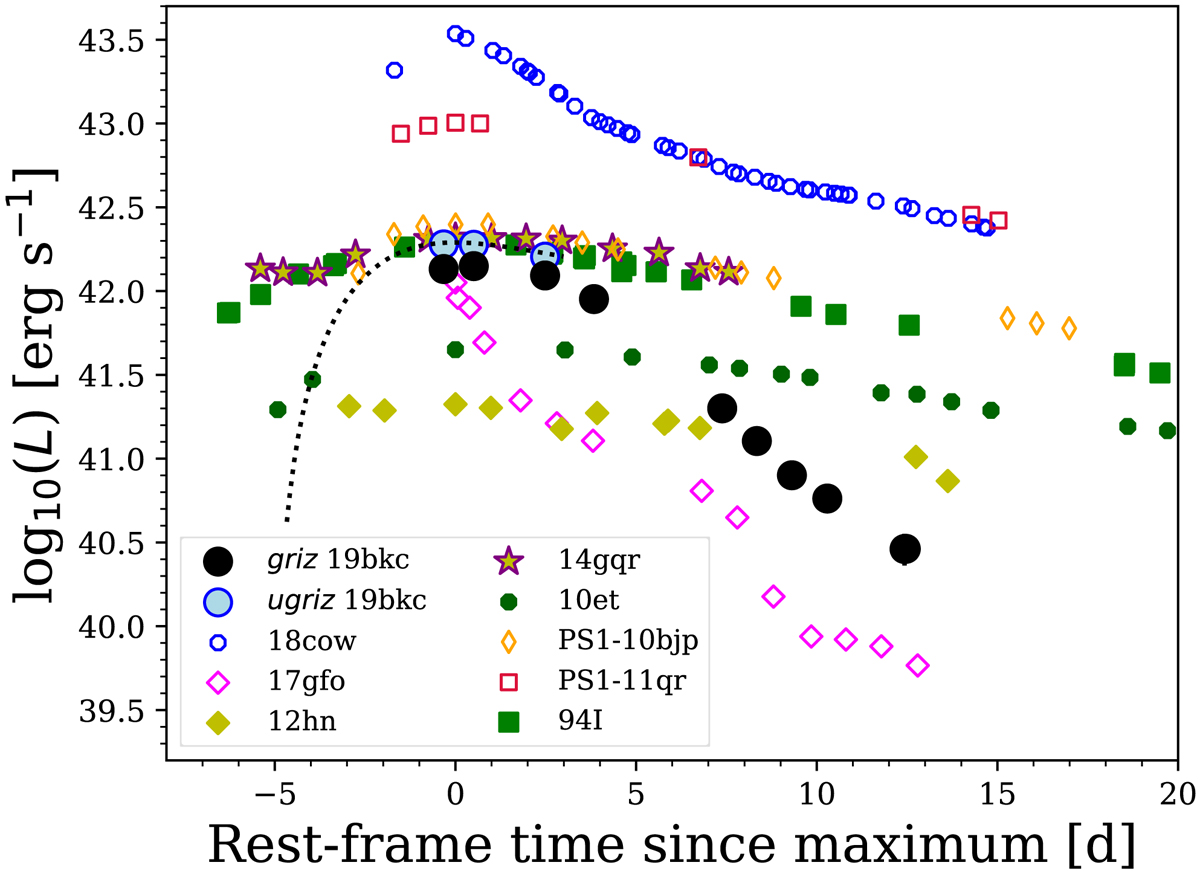
griz (black solid circles) and ugriz (blue filled circles) pseudo-bolometric light curves of SN 2019bkc (black) shown in comparison to the griz pseudo-bolometric light curves of Type Ic SN 1994I (green), kilonova AT 2017gfo (Smartt et al. 2017), AT2018cow (Prentice et al. 2018a), and fast blue transients PS1-10bjp and PS1-11qr (Drout et al. 2014), Ca-rich SNe 2012hn (Valenti et al. 2014) and 2010et (Kasliwal et al. 2012), and “ultra-stripped” Ca-rich iPTF14gqr (De et al. 2018a). The dotted black line shows the best fit analytic 56Ni powered light curve model of Valenti et al. (2008), fit to the ugriz bolometric light curve until 9 days after explosion.
Current usage metrics show cumulative count of Article Views (full-text article views including HTML views, PDF and ePub downloads, according to the available data) and Abstracts Views on Vision4Press platform.
Data correspond to usage on the plateform after 2015. The current usage metrics is available 48-96 hours after online publication and is updated daily on week days.
Initial download of the metrics may take a while.