Fig. 4.
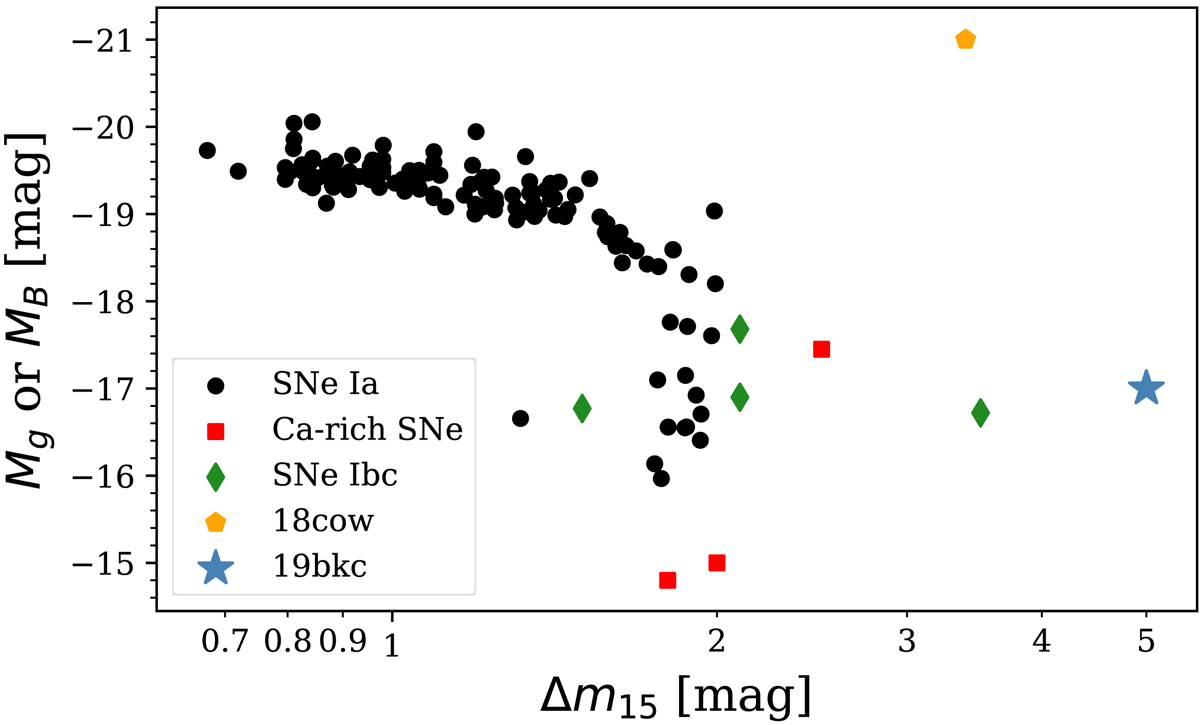
Peak absolute magnitude in B or g as a function of decline rate for a selection of transients and SN 2019bkc. Differences in magnitude system and filter bandpass are negligible for the purpose of this plot which shows that the rapid decline of SN 2019bkc is unprecedented compared to the comparison objects. The SNe Ia data are from Galbany et al. (2019).
Current usage metrics show cumulative count of Article Views (full-text article views including HTML views, PDF and ePub downloads, according to the available data) and Abstracts Views on Vision4Press platform.
Data correspond to usage on the plateform after 2015. The current usage metrics is available 48-96 hours after online publication and is updated daily on week days.
Initial download of the metrics may take a while.