Fig. 3.
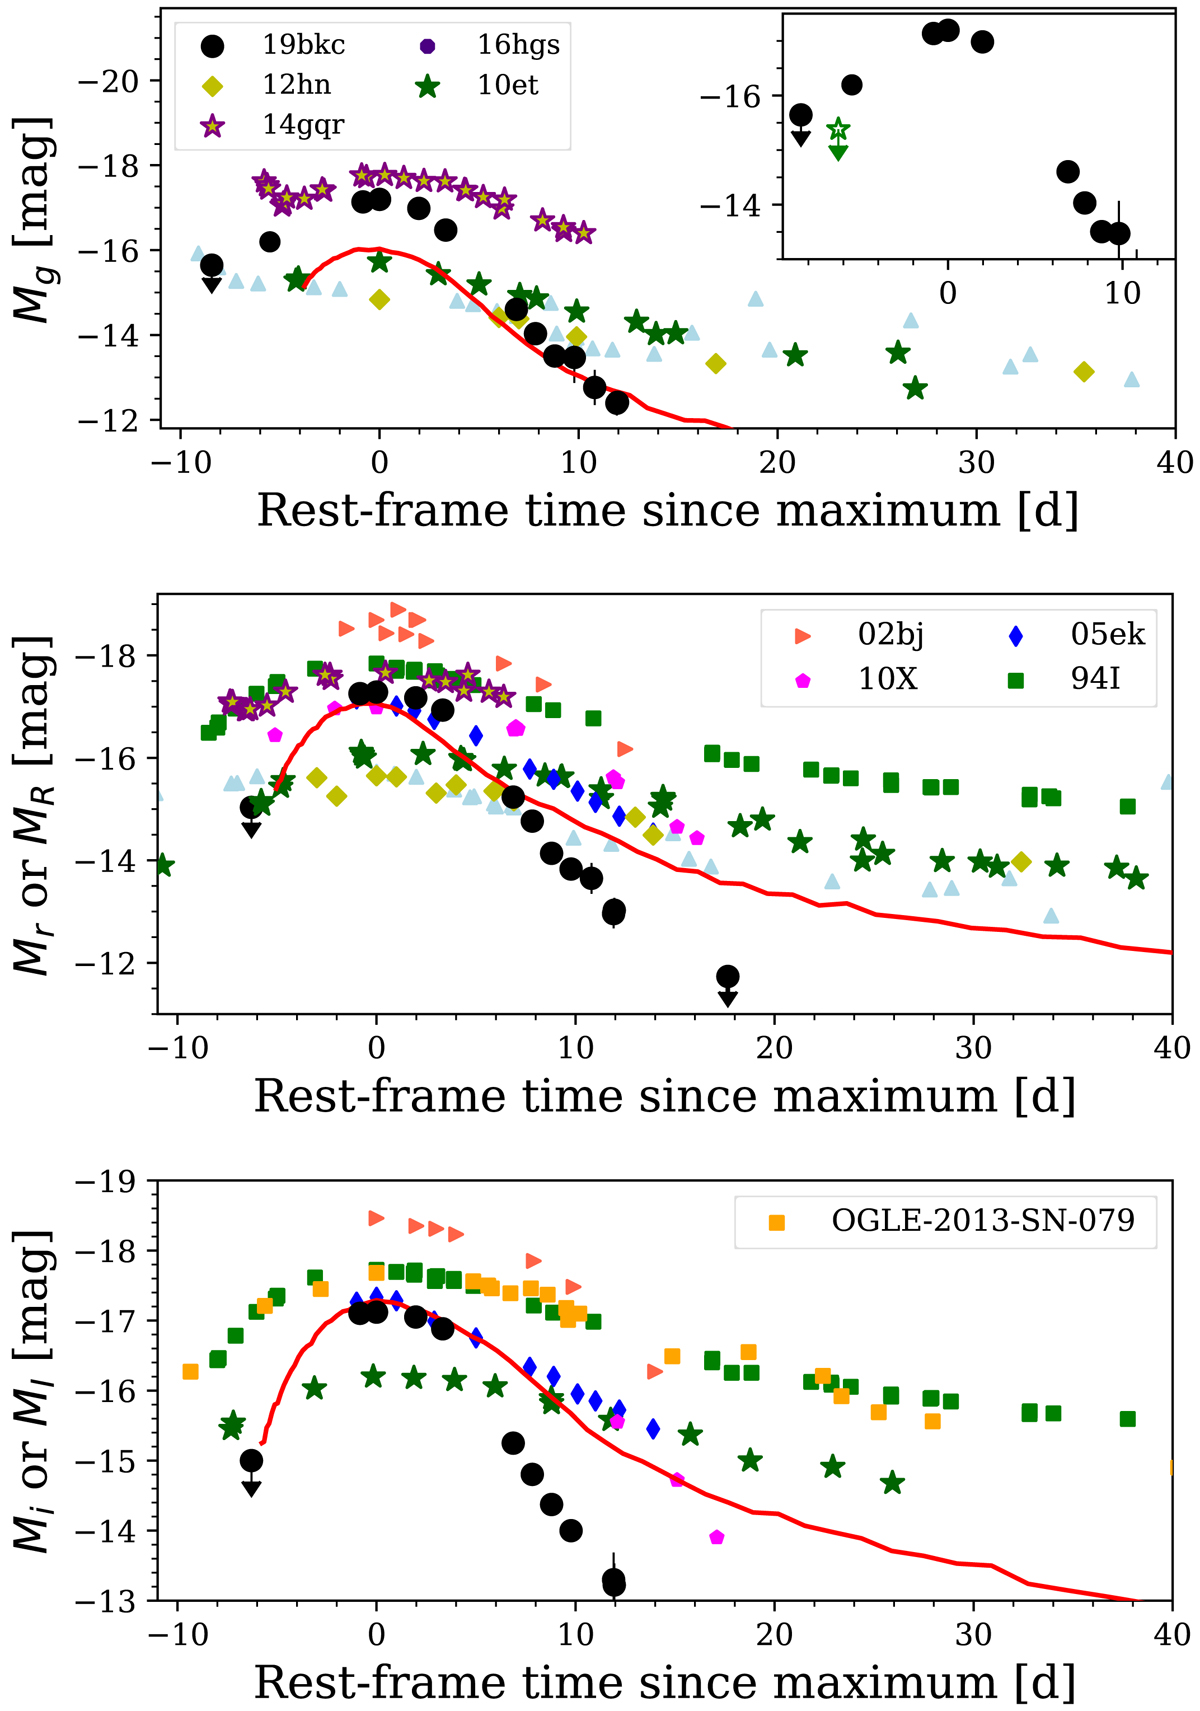
Top: g-band light curves of various fast transients; SN 2019bkc and the Ca-rich SNe 2010et, 2012hn, iPTF14gqr, and iPTF16hgs. The red line is the ELDD-L model from Sim et al. (2012). The inset shows the g band light curve with an estimated upper limit of 19.5 mag (green star) derived from the ATLAS-o band magnitude of 19.8 assuming the SED is a black body at ∼20 000 K. Middle: r or R band light curves including SNe Ic 2005ek and 1994I, and the unusual transients SNe 2010X and 2002bj. Bottom: i or I band comparison with the addition of the Ti-dominated transient OGLE-2013-SN-079. The initial ATLAS-o non-detection is treated as if it was in r and i respectively.
Current usage metrics show cumulative count of Article Views (full-text article views including HTML views, PDF and ePub downloads, according to the available data) and Abstracts Views on Vision4Press platform.
Data correspond to usage on the plateform after 2015. The current usage metrics is available 48-96 hours after online publication and is updated daily on week days.
Initial download of the metrics may take a while.