Fig. 2.
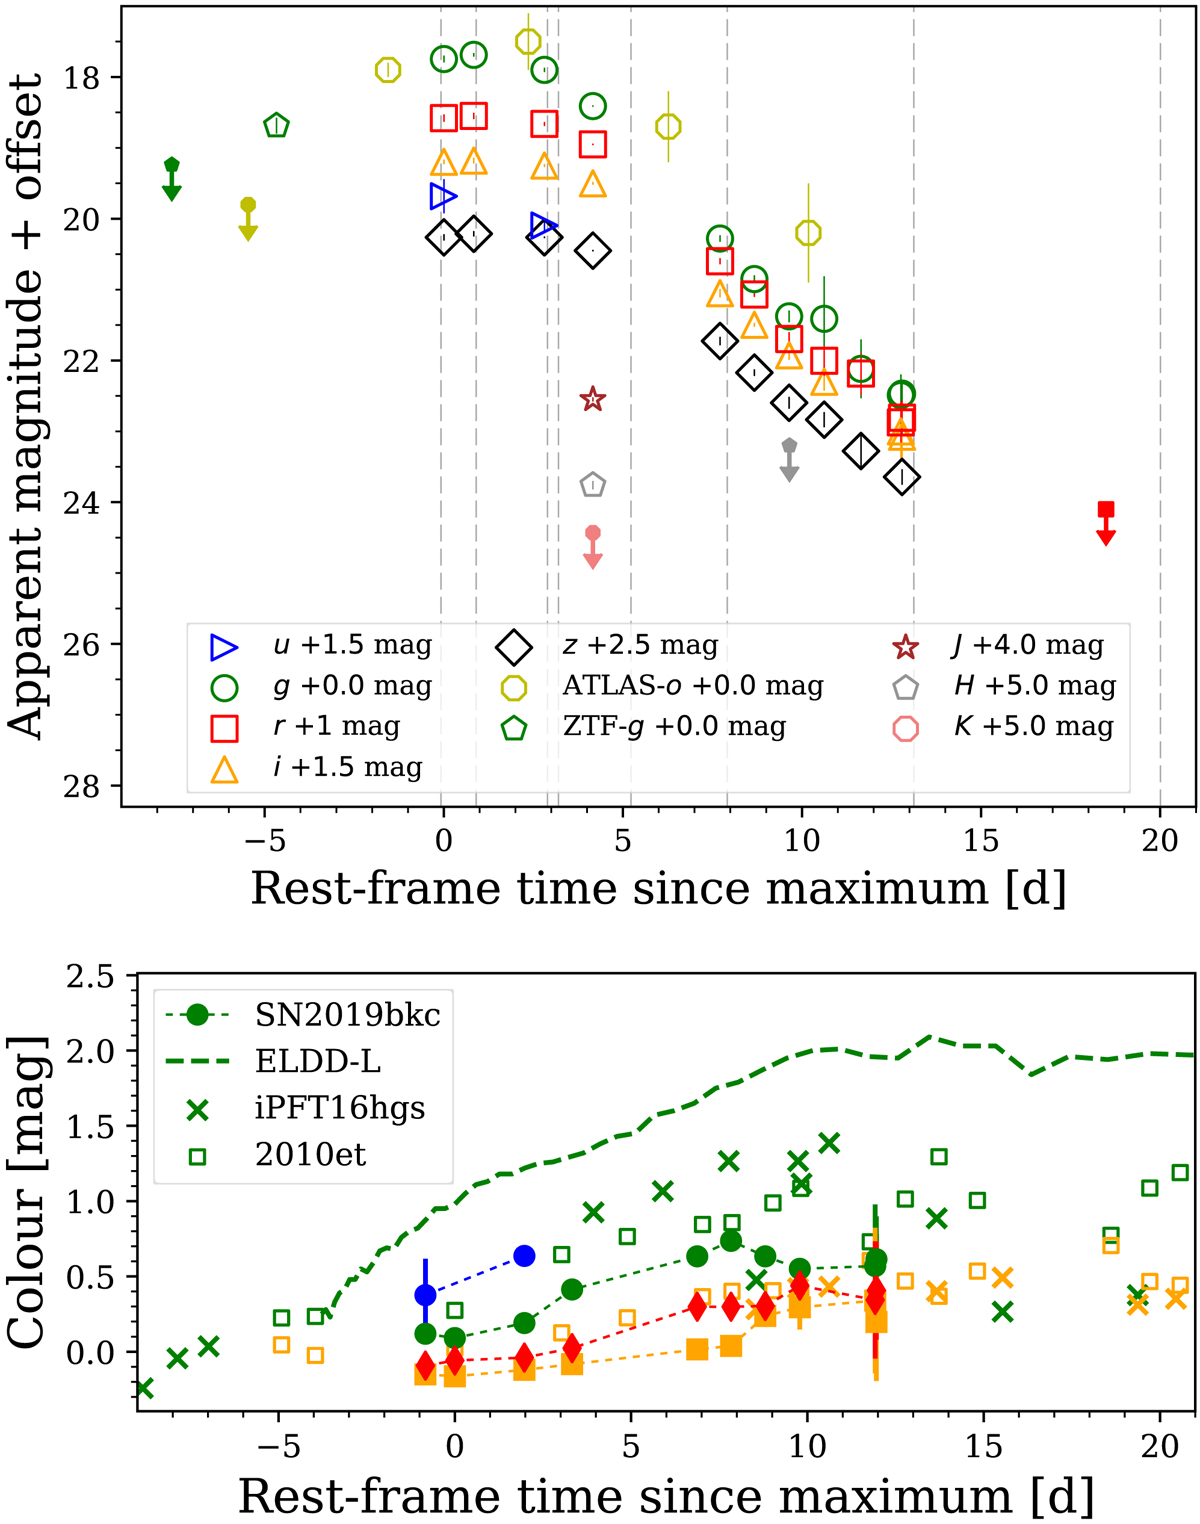
Top: multi-colour light curves of SN 2019bkc from ZTF, ATLAS, LT, GROND, and NTT. NIR observations are from GROND and the LT. The grey dashed lines denote spectroscopic observations. Bottom: colour evolution in u − g (blue), g − r (green), r − i (orange), and i − z (red). The dashed line is the g − r colour curve of the Sim et al. (2012) low-mass edge-lit double detonation (ELDD-L) model and SN 2019bkc is seen to be significantly bluer than this model. Also shown are the g − r and r − i colour curves of iPTF16hgs (De et al. 2018b) and SN 2010et (Kasliwal et al. 2012), with the latter requiring interpolation to match the observed dates.
Current usage metrics show cumulative count of Article Views (full-text article views including HTML views, PDF and ePub downloads, according to the available data) and Abstracts Views on Vision4Press platform.
Data correspond to usage on the plateform after 2015. The current usage metrics is available 48-96 hours after online publication and is updated daily on week days.
Initial download of the metrics may take a while.