Fig. 12.
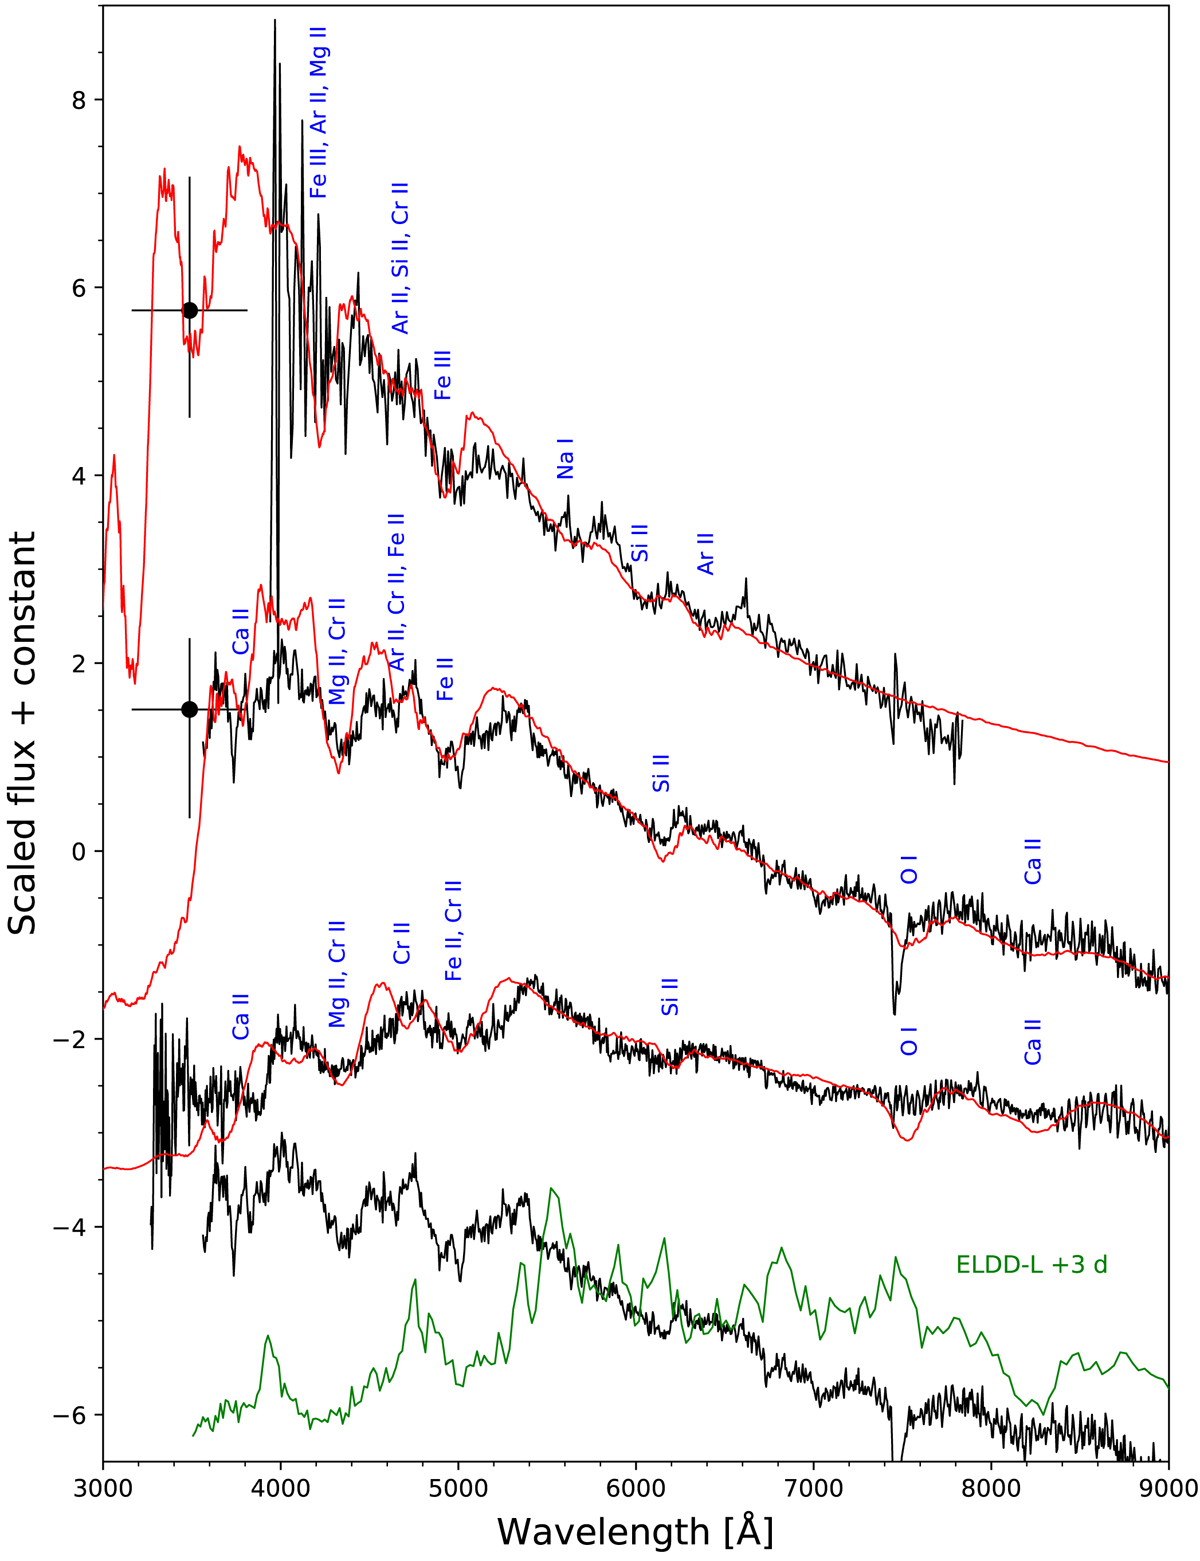
Spectroscopic modelling of SN 2019bkc (red) using a density profile with Mej ∼ 0.2 M⊙ and Ek ∼ 2 × 1050 erg compared with observed spectra at −0.1, +3.1, and +5.1 d (black). Prominent elements are noted along with the u-band fluxes used to constrain the models. Also included is the scaled ELDD-L model spectrum from Sim et al. (2012) (green) at ∼3 d after maximum compared to our spectra of SN 2019bkc at a similar phase.
Current usage metrics show cumulative count of Article Views (full-text article views including HTML views, PDF and ePub downloads, according to the available data) and Abstracts Views on Vision4Press platform.
Data correspond to usage on the plateform after 2015. The current usage metrics is available 48-96 hours after online publication and is updated daily on week days.
Initial download of the metrics may take a while.