Fig. 11.
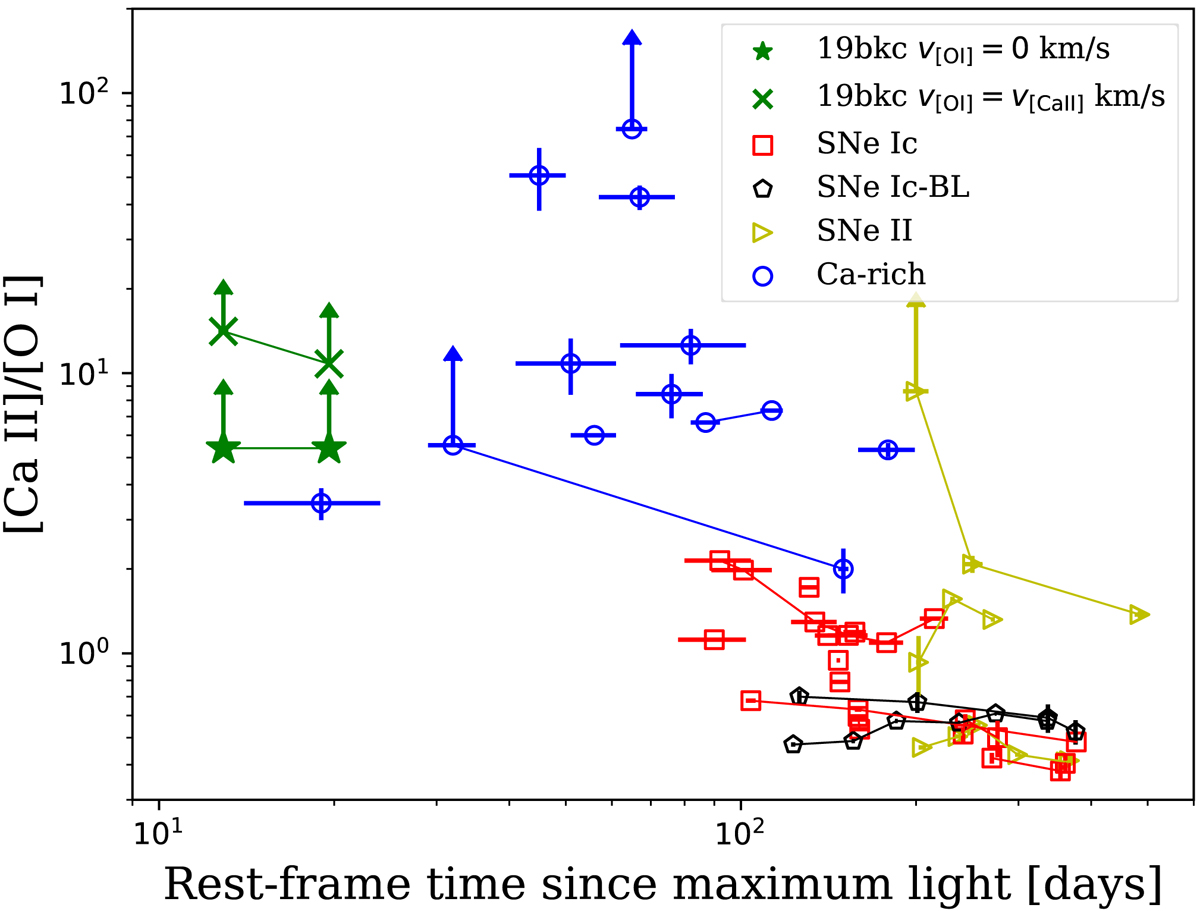
Ratio of [Ca II] λλ 7291, 7324 to [O I] λλ 6300, 6363 for a sample of core-collapse SNe and Ca-rich events; the ratio is significantly larger in Ca-rich objects. SN 2019bkc is shown in green calculated for two velocity positions, 0 km s−1 and if it has the same offset as the [Ca II] and Ca II lines. Ancillary data from Valenti et al. (2014).
Current usage metrics show cumulative count of Article Views (full-text article views including HTML views, PDF and ePub downloads, according to the available data) and Abstracts Views on Vision4Press platform.
Data correspond to usage on the plateform after 2015. The current usage metrics is available 48-96 hours after online publication and is updated daily on week days.
Initial download of the metrics may take a while.