Fig. 10.
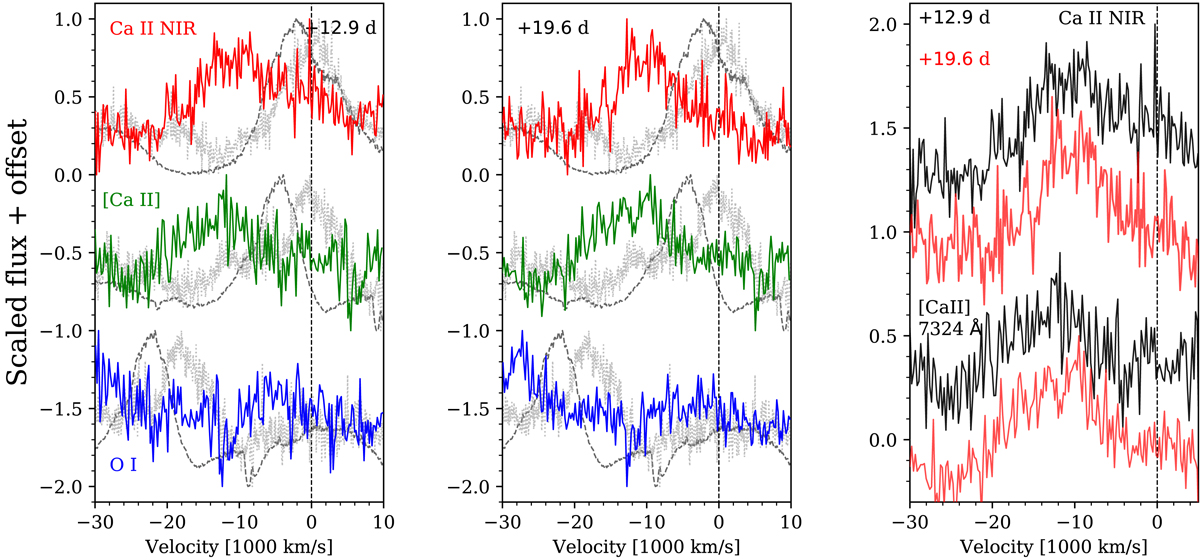
Left and centre: spectra of SNe 2019bkc (line), 2012hn (black dashed), and 2010et (grey dotted) centred in velocity space on the rest position of Ca II NIR (red), [Ca II] λ 7324 (green), and O Iλ 7772 (blue) respectively for +12.9 d (left) and +19.6 d (centre). A telluric feature is present in the O I feature at ∼11 000 km s−1 and the peaks at −23 000 and −18 000 km s−1 for SNe 2012hn and 2010et, respectively, are the [Ca II] features located to the blue of this O I feature. Right: Ca II NIR (top) and [Ca II] (bottom) lines plotted in sequence for the two epochs. The Ca II NIR triplet is consistent with no velocity evolution, while the [Ca II] line appears to decrease in velocity. Given the S/N of the spectrum this may not be real.
Current usage metrics show cumulative count of Article Views (full-text article views including HTML views, PDF and ePub downloads, according to the available data) and Abstracts Views on Vision4Press platform.
Data correspond to usage on the plateform after 2015. The current usage metrics is available 48-96 hours after online publication and is updated daily on week days.
Initial download of the metrics may take a while.