Fig. 9.
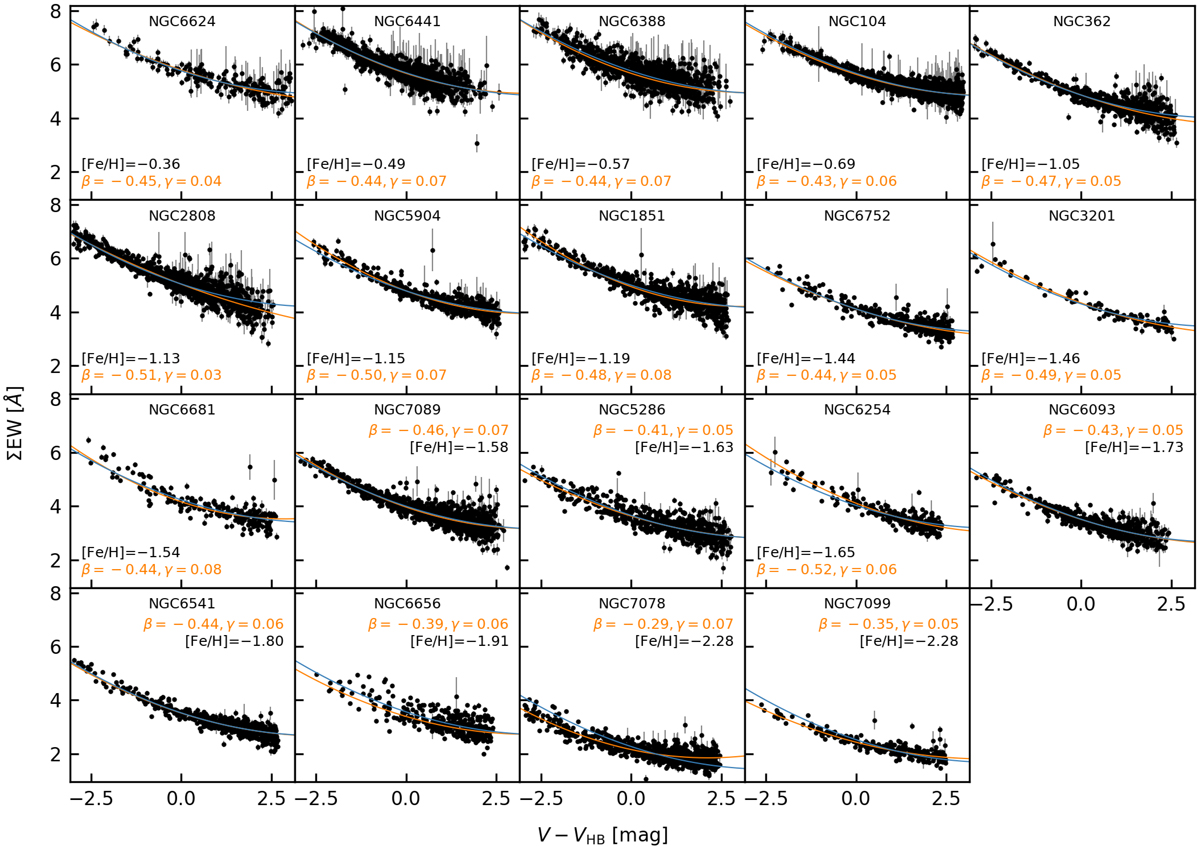
Similarly to Fig. 7, the sum of the equivalent widths ΣEW of the two strongest Ca lines is plotted over V − VHB for all RGB stars. Quadratic fits to each individual cluster are shown in orange, while a global fit, where the same values for β and γ are used (giving β = −0.442 ± 0.002 and γ = 0.058 ± 0.001), is plotted for each cluster in blue.
Current usage metrics show cumulative count of Article Views (full-text article views including HTML views, PDF and ePub downloads, according to the available data) and Abstracts Views on Vision4Press platform.
Data correspond to usage on the plateform after 2015. The current usage metrics is available 48-96 hours after online publication and is updated daily on week days.
Initial download of the metrics may take a while.