Fig. 8.
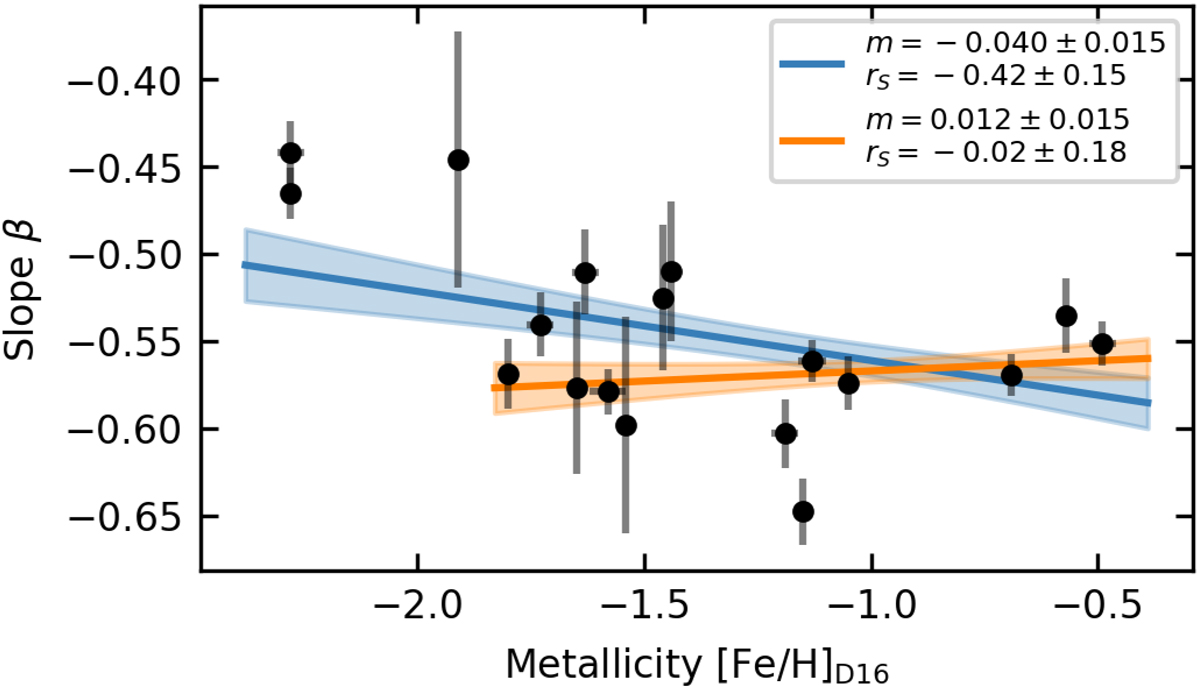
Slopes β from individual fits for each cluster are shown as a function of metallicity. The blue line indicates a linear fit to the data with the shaded area representing its 1σ uncertainty band, while the orange line is the equivalent when ignoring the three most metal-poor clusters. As discussed in the text, there might be a real trend, but for the further analysis we assume β to be constant.
Current usage metrics show cumulative count of Article Views (full-text article views including HTML views, PDF and ePub downloads, according to the available data) and Abstracts Views on Vision4Press platform.
Data correspond to usage on the plateform after 2015. The current usage metrics is available 48-96 hours after online publication and is updated daily on week days.
Initial download of the metrics may take a while.