Fig. 3.
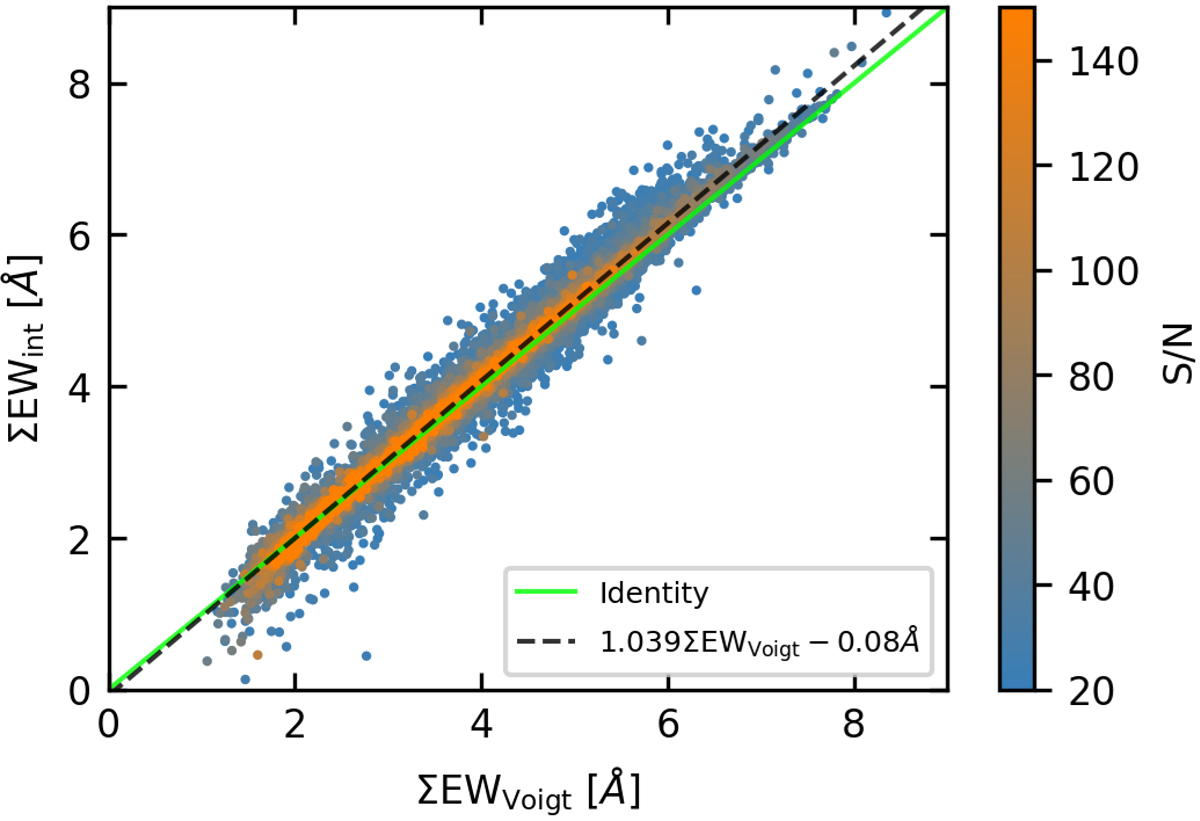
Comparison between equivalent widths derived from simply integrating the lines in the given bandpasses (ΣEWint) and from fitting Voigt profiles (ΣEWVoigt) for all spectra with S/N > 20 and the S/N as color-coding. Note that we clipped the color range to a maximum value of 150, although we reach S/N of up to 400 for single spectra. The dashed black line provides a linear fit to the data, while the green one indicates the identity.
Current usage metrics show cumulative count of Article Views (full-text article views including HTML views, PDF and ePub downloads, according to the available data) and Abstracts Views on Vision4Press platform.
Data correspond to usage on the plateform after 2015. The current usage metrics is available 48-96 hours after online publication and is updated daily on week days.
Initial download of the metrics may take a while.