Free Access
Fig. 23.
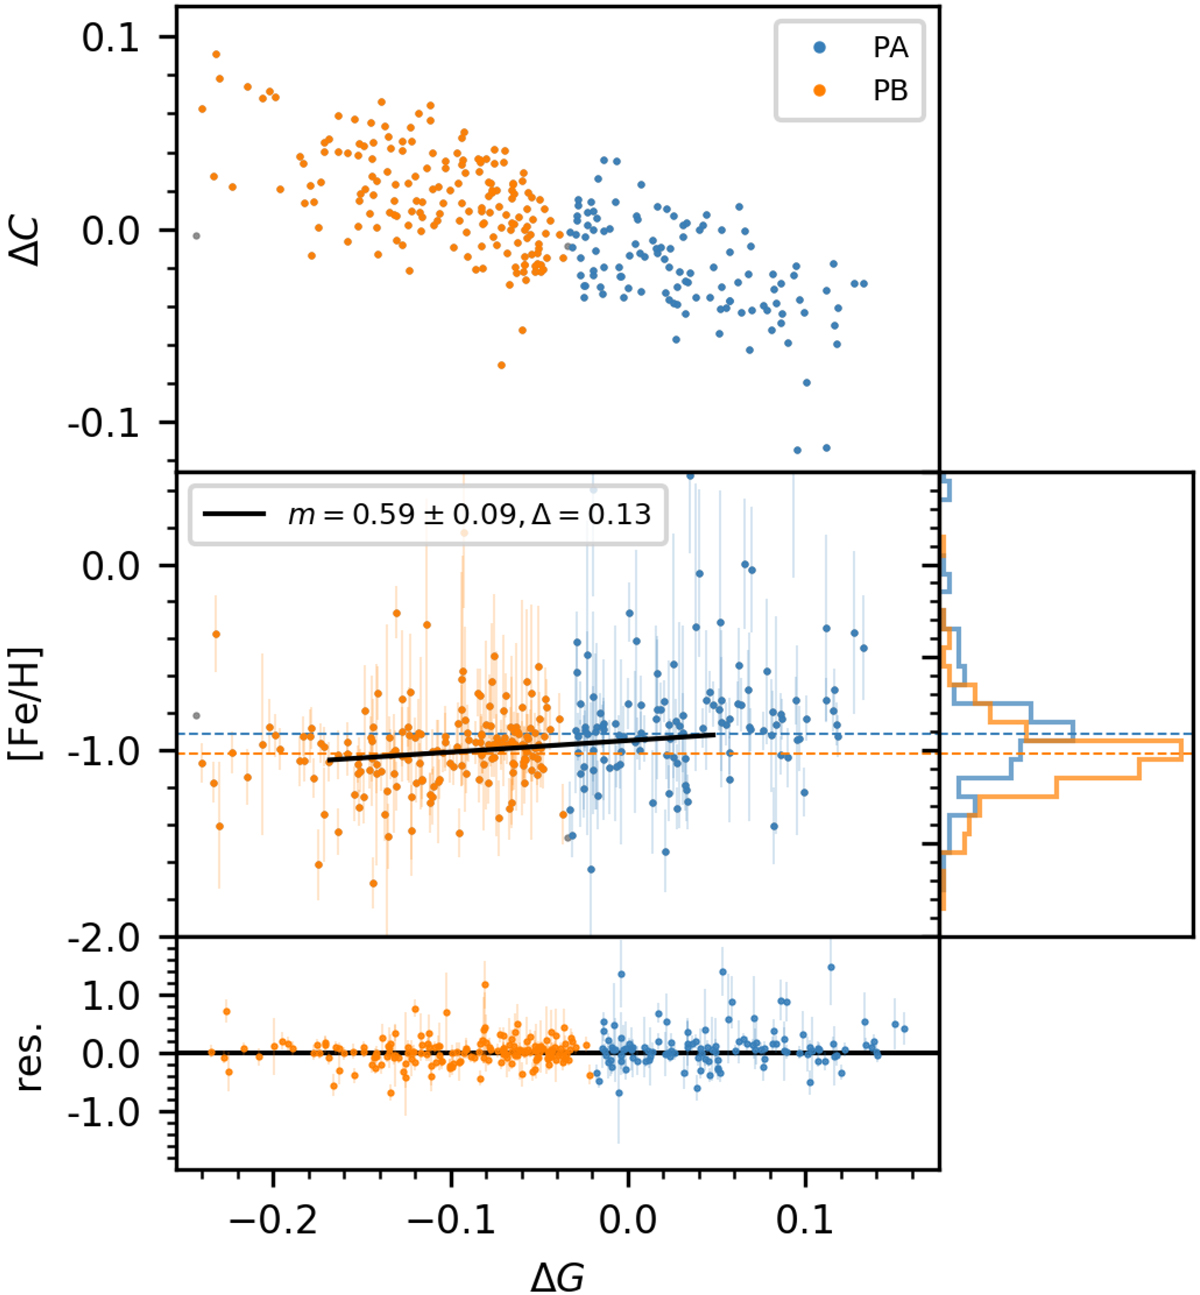
Splitting population P1 of NGC 2808 into two sub-populations A and B. While the upper panel shows the chromosome map, the metallicity as function of ΔG is plotted in the lower panels, together with residuals to a linear regression (black line) and a histogram of the two populations.
Current usage metrics show cumulative count of Article Views (full-text article views including HTML views, PDF and ePub downloads, according to the available data) and Abstracts Views on Vision4Press platform.
Data correspond to usage on the plateform after 2015. The current usage metrics is available 48-96 hours after online publication and is updated daily on week days.
Initial download of the metrics may take a while.