Fig. 21.
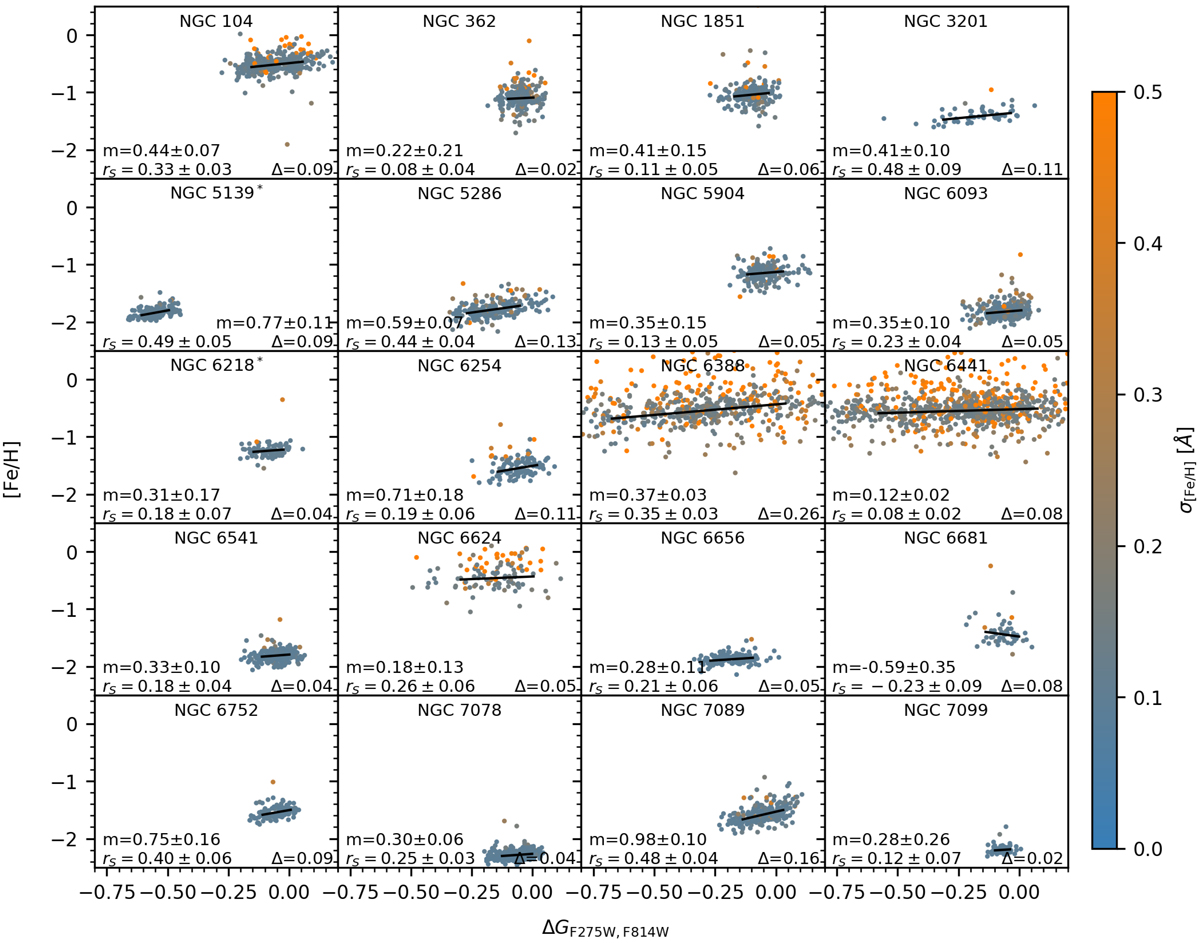
Metallicity as a function of ΔG = ΔF275W, F814W is plotted for the primordial populations P1 in all clusters in our sample with available UV photometry. The black lines show a linear fit (with the length being the FWHM of the distribution) and values are given for the fitted slopes m, the Spearman correlation coefficients rS, and the differences Δ in metallicity between the extremities of the black lines. Note that for NGC 6388 and NGC 6441 not the full ranges are shown.
Current usage metrics show cumulative count of Article Views (full-text article views including HTML views, PDF and ePub downloads, according to the available data) and Abstracts Views on Vision4Press platform.
Data correspond to usage on the plateform after 2015. The current usage metrics is available 48-96 hours after online publication and is updated daily on week days.
Initial download of the metrics may take a while.