Fig. 20.
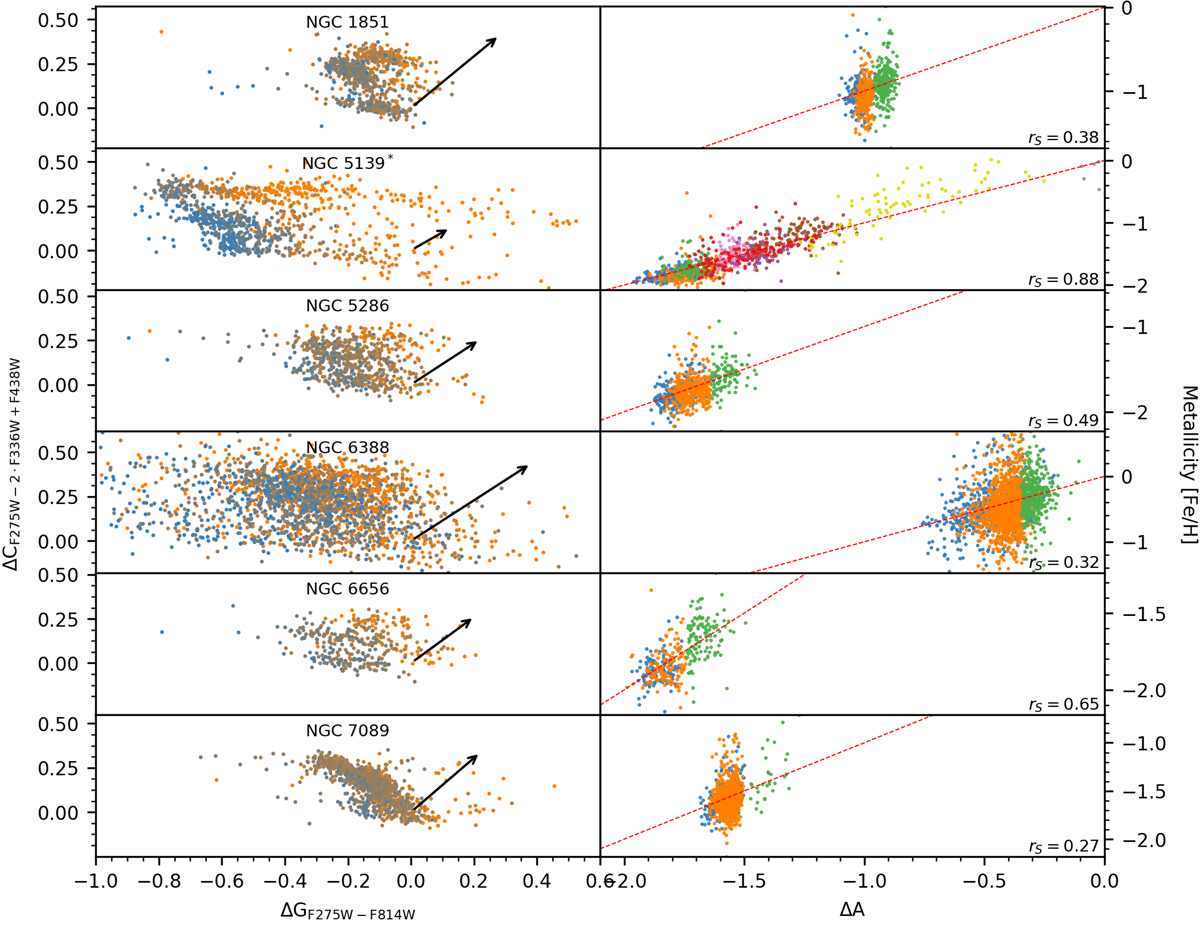
Left panels: chromosome maps for all our Type II clusters, color-coded with our derived metallicity, ranging from the median minus 0.3 (blue) to median plus 0.3 dex (orange). The arrows show the directions of the metallicity slopes and their lengths indicate a change of 0.15 dex. Right panels: metallicities as function of a pseudo-color ΔA along the arrows on the left, color-coded by population. A linear fit to the data is shown as dashed red line. The Spearman correlation coefficient rS is given for every cluster.
Current usage metrics show cumulative count of Article Views (full-text article views including HTML views, PDF and ePub downloads, according to the available data) and Abstracts Views on Vision4Press platform.
Data correspond to usage on the plateform after 2015. The current usage metrics is available 48-96 hours after online publication and is updated daily on week days.
Initial download of the metrics may take a while.