Fig. 2.
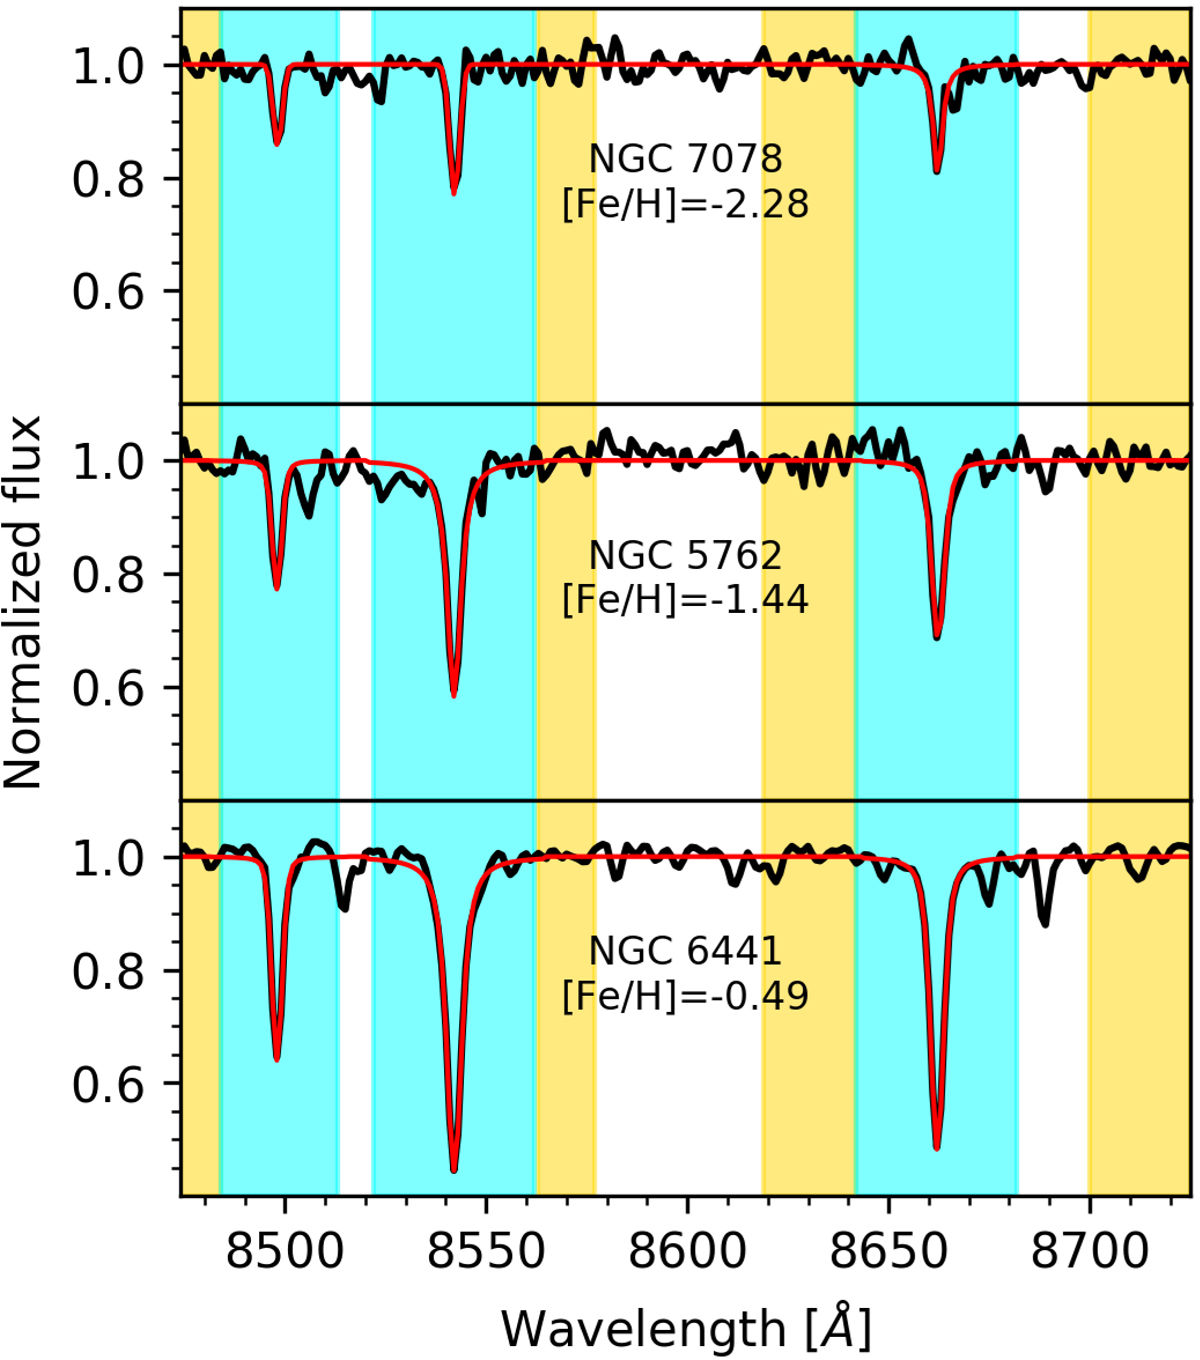
Three example spectra with S/N ≈ 50 from different clusters covering the whole range of metallicities in our sample. The observed spectra are shown in black, overplotted with the best fitting Voigt profiles. The areas marked in yellow were used for the continuum correction, while those in blue define the line bandpasses that were used for fitting the Voigt profiles and calculating the equivalent widths. The given metallicities are mean cluster metallicities from Dias et al. (2016).
Current usage metrics show cumulative count of Article Views (full-text article views including HTML views, PDF and ePub downloads, according to the available data) and Abstracts Views on Vision4Press platform.
Data correspond to usage on the plateform after 2015. The current usage metrics is available 48-96 hours after online publication and is updated daily on week days.
Initial download of the metrics may take a while.