Fig. 19.
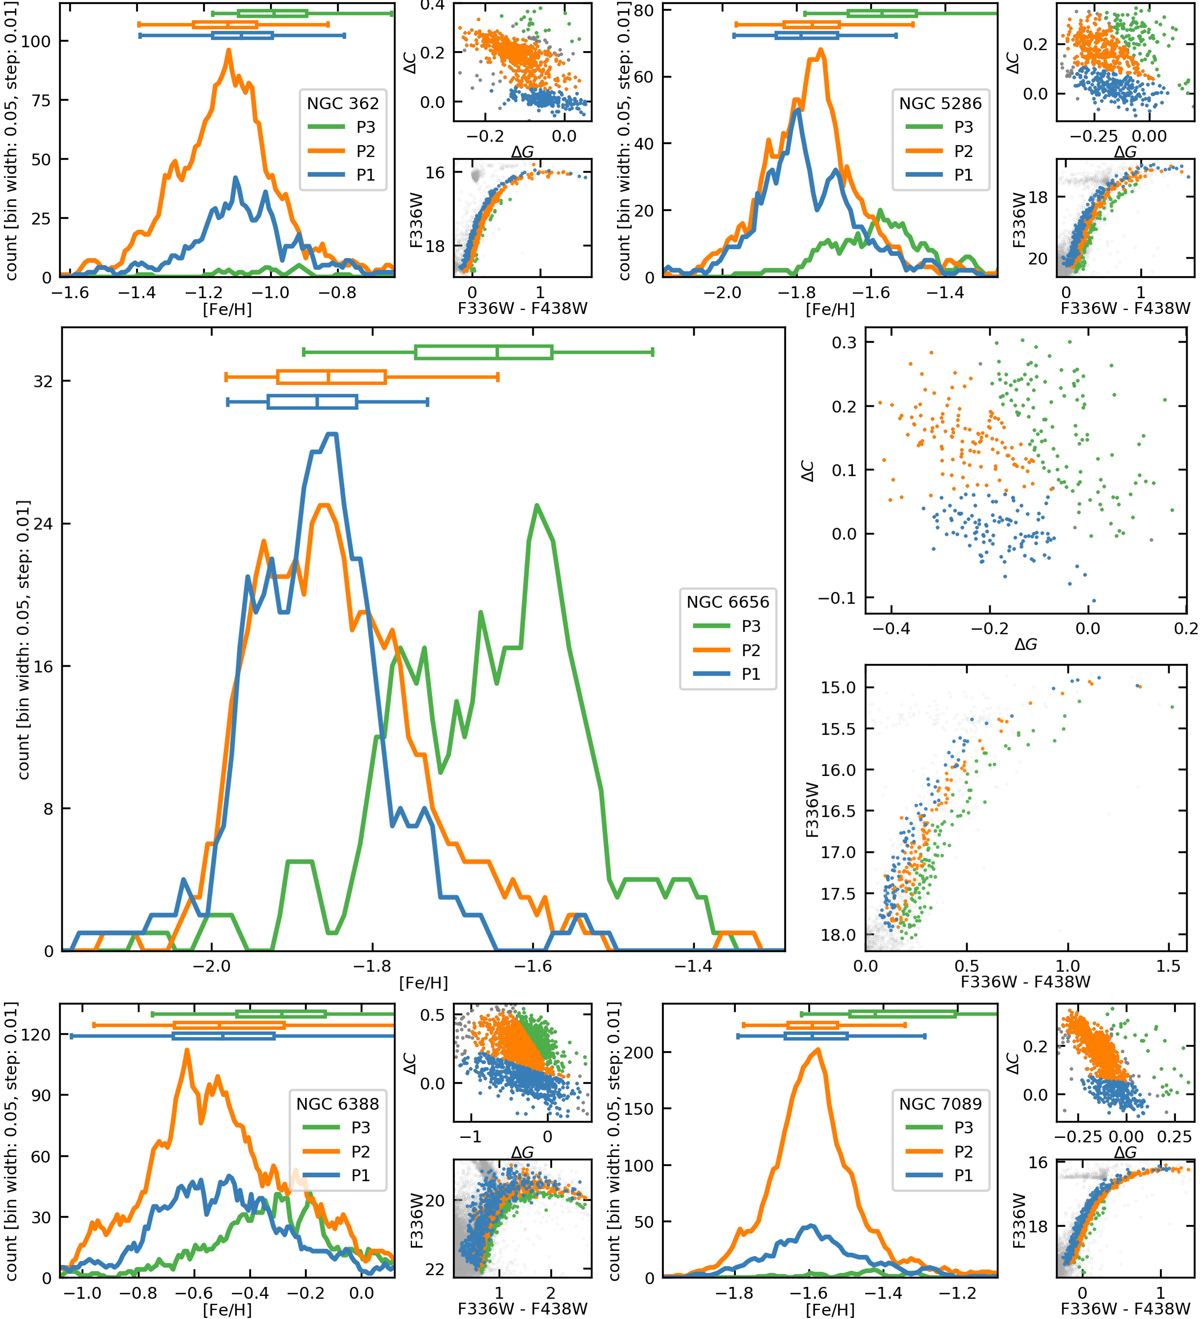
Metallicity distributions for the stellar populations of five more Type II clusters are shown in the big panels (as in Fig. 15 for NGC 1851). The upper smaller panels show the chromosome maps and the lower panels the CMDs of the RGBs of the respective clusters (both as in Fig. 1). The color-coding is the same in all plots for a single cluster.
Current usage metrics show cumulative count of Article Views (full-text article views including HTML views, PDF and ePub downloads, according to the available data) and Abstracts Views on Vision4Press platform.
Data correspond to usage on the plateform after 2015. The current usage metrics is available 48-96 hours after online publication and is updated daily on week days.
Initial download of the metrics may take a while.