Fig. 16.
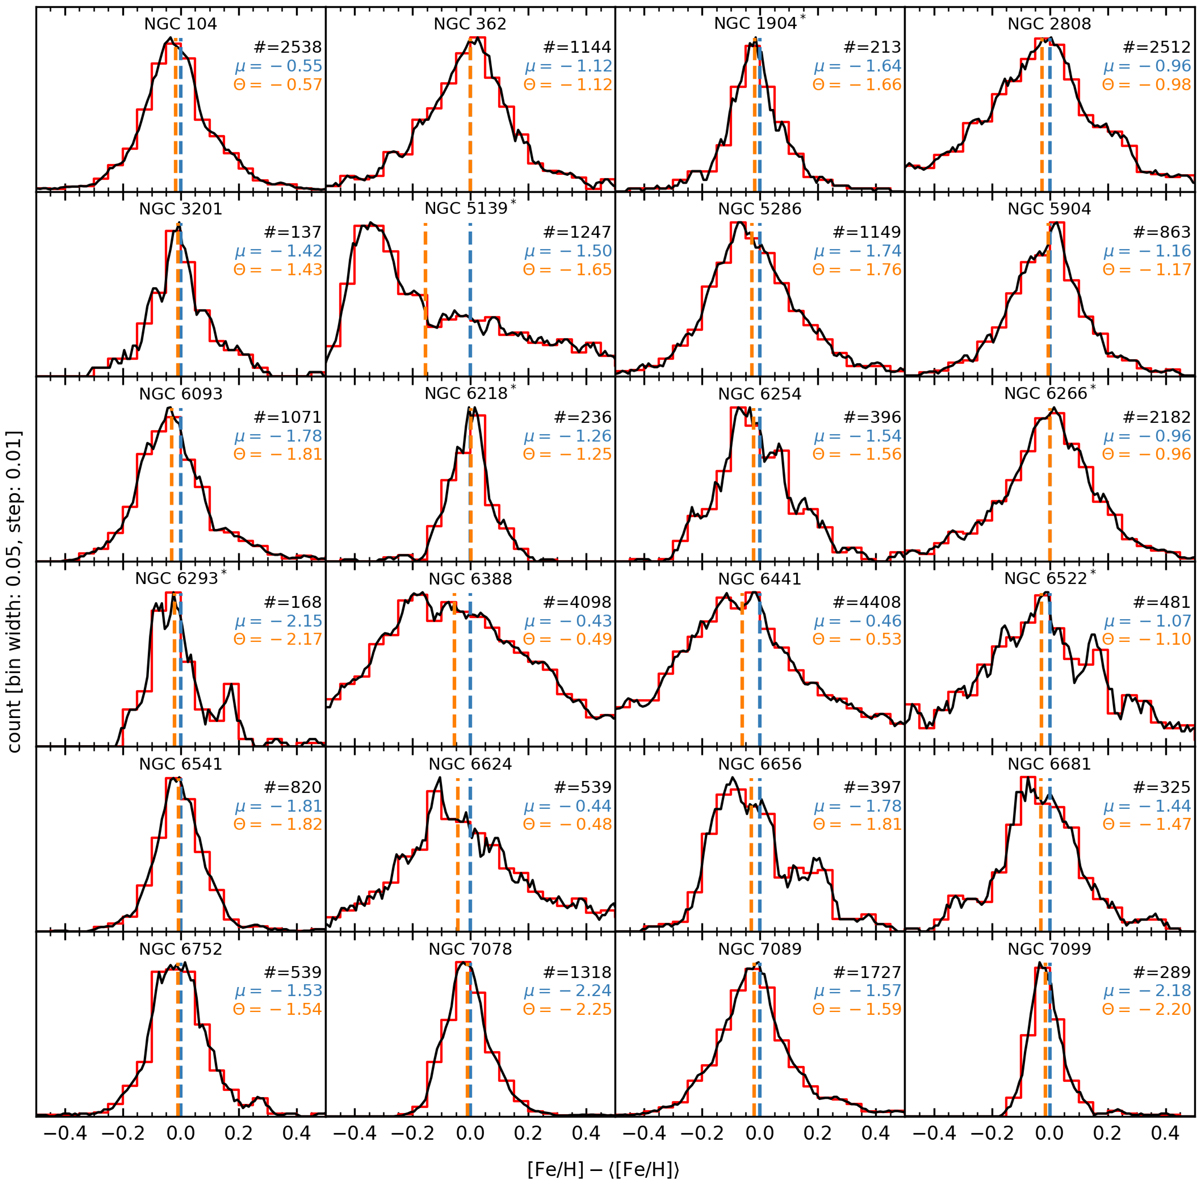
Classic (red) and rolling (black) histograms for the [Fe/H] distributions for all clusters (except NGC 1851, which is shown in Fig. 15) as derived from the CaT relation. The metallicities for all clusters are shifted by their respective means so that they peak around 0. The x axes all show the same range within ±0.5 dex, while the y axes are scaled to the peak values of each clusters. Horizontal grid lines are shown at peak height and at half that height, while vertical lines are located at 0, ±0.2, and ±0.4 dex. For each cluster, the number of stars is given (#) that have been used for calculating the distribution, as well as the mean μ = ⟨[Fe/H]⟩ and the median Θ. All the numbers are also given in Table 7.
Current usage metrics show cumulative count of Article Views (full-text article views including HTML views, PDF and ePub downloads, according to the available data) and Abstracts Views on Vision4Press platform.
Data correspond to usage on the plateform after 2015. The current usage metrics is available 48-96 hours after online publication and is updated daily on week days.
Initial download of the metrics may take a while.