Fig. 15.
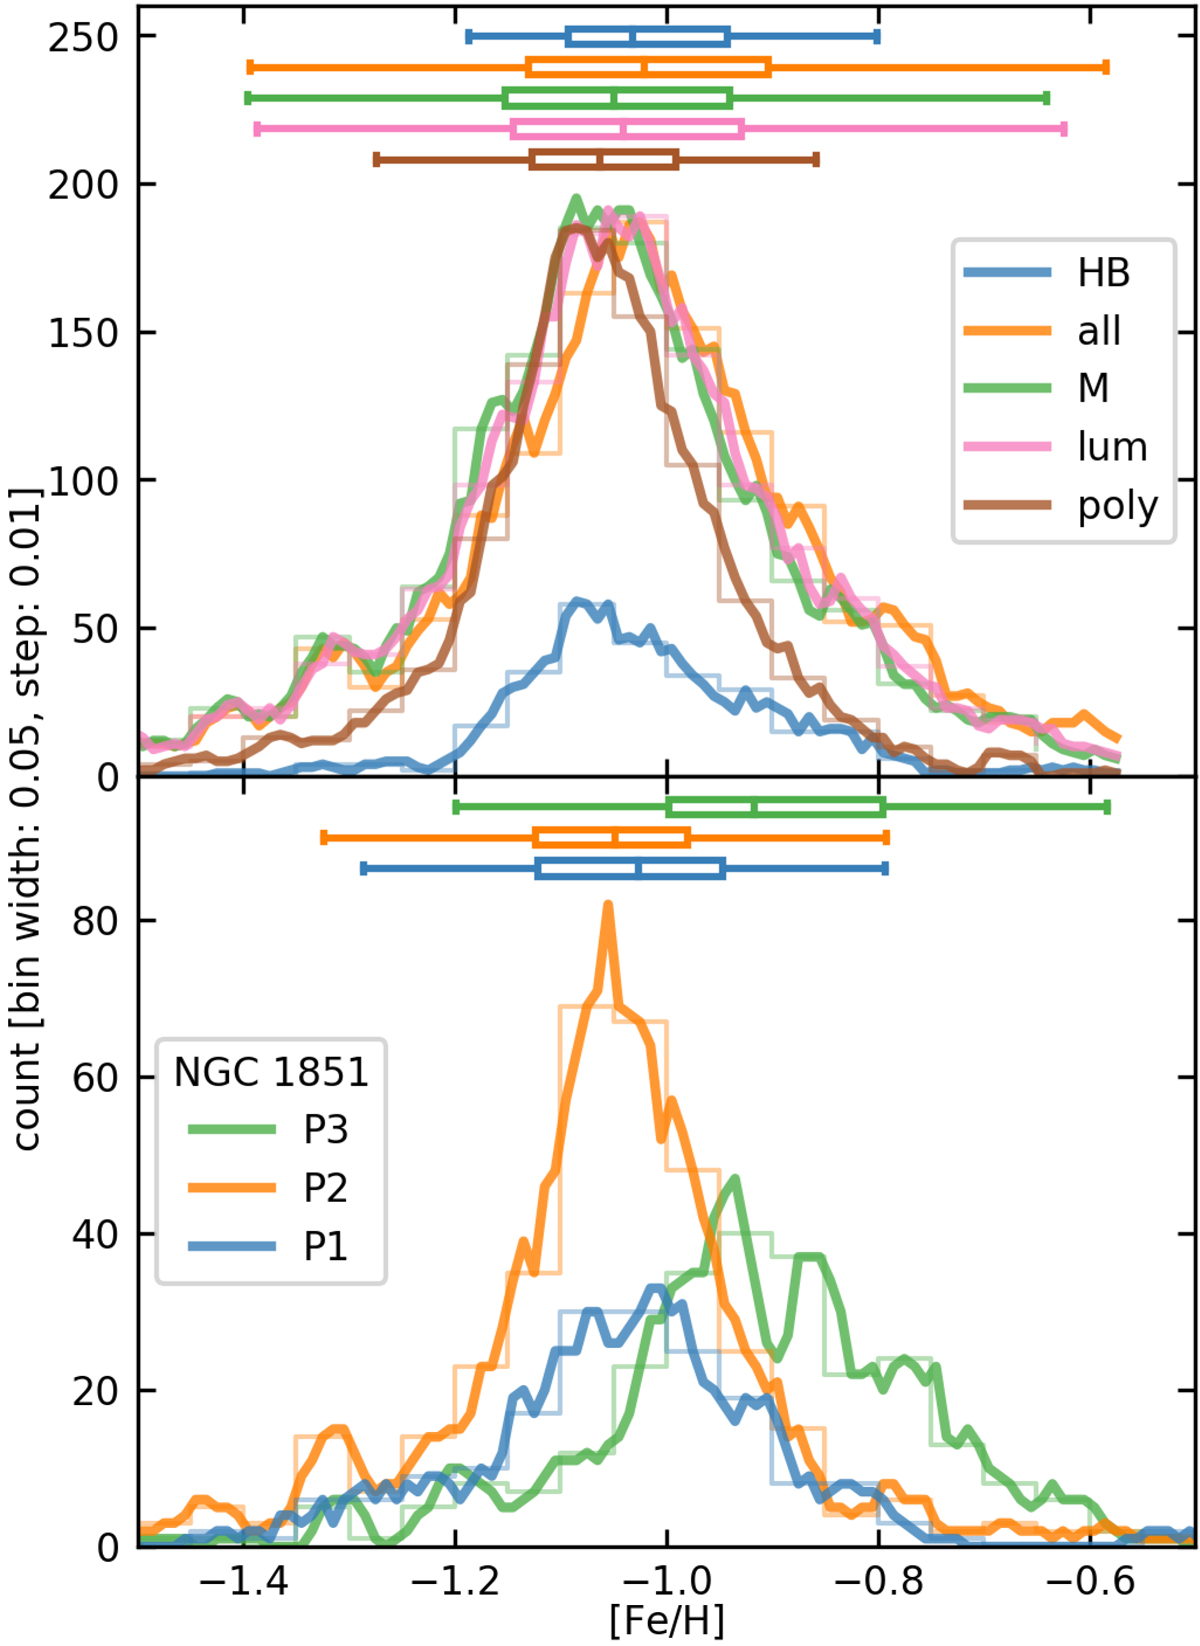
Metallicity distributions for NGC 1851 as derived from all four CaT-metallicity relations discussed in the text are shown in the upper panel, while distributions for the three populations we obtained from the chromosome map in Fig. 1 for the “all” calibration from above are shown in the lower panel. As for all the following, similar plots, the bars at the top of the plots show the 5–95% range of the data (lines with caps), the interquartile range (Q1–Q2, boxes) and medians (vertical line) for all distributions.
Current usage metrics show cumulative count of Article Views (full-text article views including HTML views, PDF and ePub downloads, according to the available data) and Abstracts Views on Vision4Press platform.
Data correspond to usage on the plateform after 2015. The current usage metrics is available 48-96 hours after online publication and is updated daily on week days.
Initial download of the metrics may take a while.