Free Access
Fig. 12.
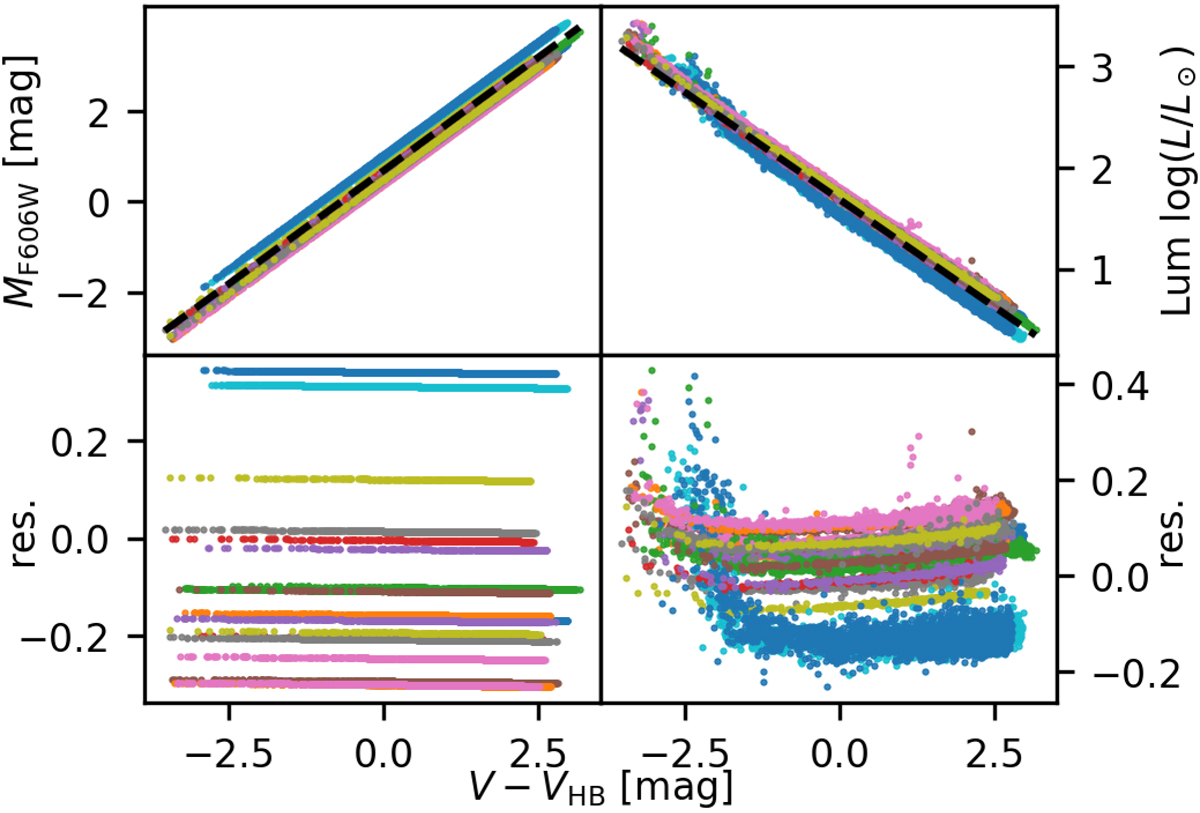
Absolute magnitude in F606W (left panels) and luminosity (right panels) over brightness difference to the HB for all stars in the sample. Different colors belong to different clusters. The dashed black lines indicate linear fits to the data, to which the differences are shown in the lower panels.
Current usage metrics show cumulative count of Article Views (full-text article views including HTML views, PDF and ePub downloads, according to the available data) and Abstracts Views on Vision4Press platform.
Data correspond to usage on the plateform after 2015. The current usage metrics is available 48-96 hours after online publication and is updated daily on week days.
Initial download of the metrics may take a while.