Fig. 7.
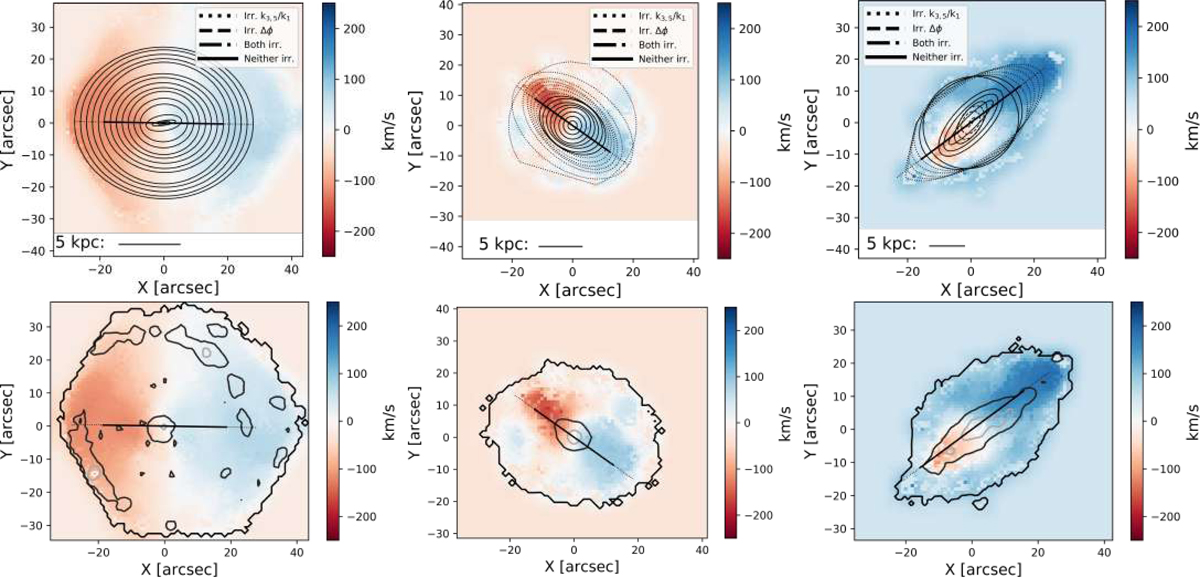
For each of the observed galaxies NGC 0932 (left column), NGC 6146 (middle column), and UGC 10205 (right column), the velocity maps of the warm ionized gas without (top row) and with (bottom row) the contours of the Hα flux overlaid (from darkest to lightest: the lowest nonzero value, 10% of the maximum, 50% of the maximum, 90% of the maximum). The angle of the solid line in each map indicates the position angle of the median best-fitting ellipse across 1.5 re. The length of the solid line equals 1 re and the length of the dotted line is equal to the remaining 0.5 re. The standard deviation of these ellipses’ position angles is σPA, and the position angles were compared with those of the stellar velocity to compute Δϕ. We note that k3, 5/k1 was calculated based on a different set of ellipses at the same radii with fixed position angles (all oriented along the solid line) and flattenings (the median flattening of the first set of ellipses). The linestyles of the ellipses correspond to the values of the irregularity parameters as follows: a solid line means that both k3, 5/k1 and Δϕ are within the regular ranges, a dotted line means that k3, 5/k1 is irregular, a dashed line means that Δϕ is irregular, and a dashed-dotted line means that both are irregular.
Current usage metrics show cumulative count of Article Views (full-text article views including HTML views, PDF and ePub downloads, according to the available data) and Abstracts Views on Vision4Press platform.
Data correspond to usage on the plateform after 2015. The current usage metrics is available 48-96 hours after online publication and is updated daily on week days.
Initial download of the metrics may take a while.