Fig. 6.
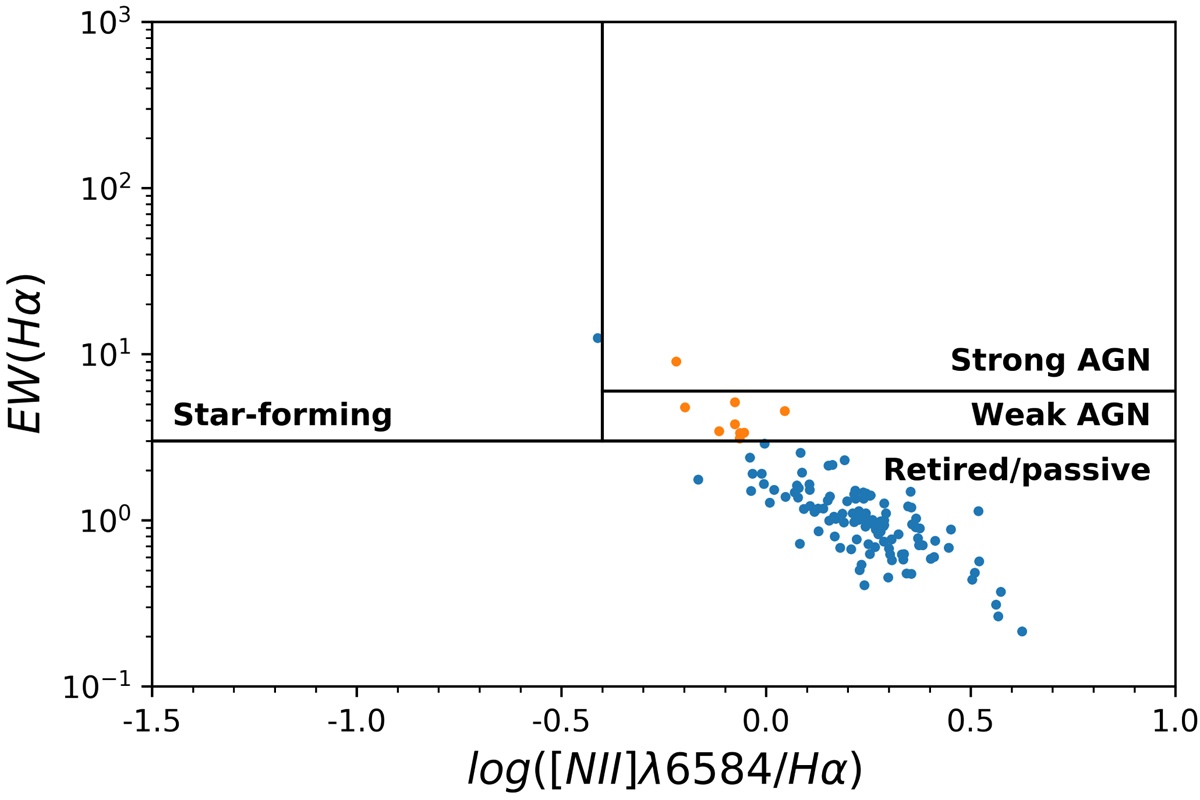
WHAN diagram for our observational data sample. Galaxies characterized as either strong or weak AGN, and thus currently subject to AGN activity, are plotted in orange, and star-forming or passive and retired galaxies are plotted in blue. All nine galaxies currently classified as strong or weak AGN are part of the clean sample as well as the full sample.
Current usage metrics show cumulative count of Article Views (full-text article views including HTML views, PDF and ePub downloads, according to the available data) and Abstracts Views on Vision4Press platform.
Data correspond to usage on the plateform after 2015. The current usage metrics is available 48-96 hours after online publication and is updated daily on week days.
Initial download of the metrics may take a while.