Fig. 5.
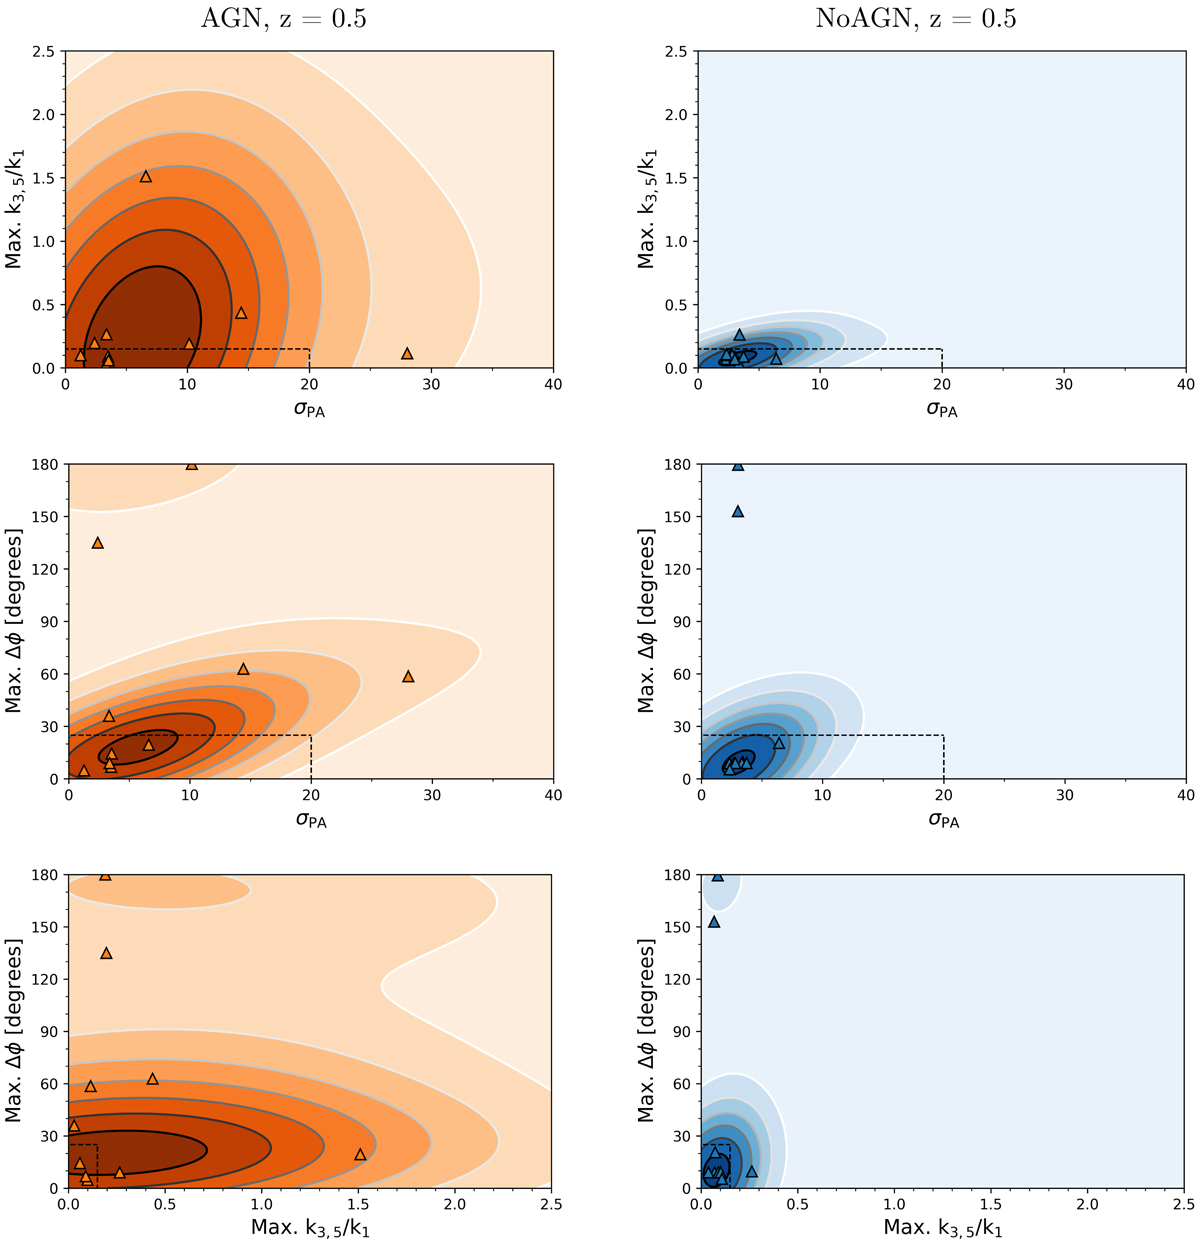
σPA vs. k3, 5/k1 (top row), σPA vs. Δϕ (middle row), and k3, 5/k1 vs. Δϕ (bottom row), for simulated galaxies with AGN feedback (left column) and without AGN feedback (right column) at z = 0.5. The triangle-shaped markers represent the maximum values within 1.5 re for our galaxies inclined edge-on, while the colored contours represent the range of maximum values exhibited by each of our galaxies at 25 random orientations. The dashed lines indicate the upper boundaries of the parameter ranges within which a galaxy’s kinematics are considered regular.
Current usage metrics show cumulative count of Article Views (full-text article views including HTML views, PDF and ePub downloads, according to the available data) and Abstracts Views on Vision4Press platform.
Data correspond to usage on the plateform after 2015. The current usage metrics is available 48-96 hours after online publication and is updated daily on week days.
Initial download of the metrics may take a while.